Health insurers who intend to sell plans on Tennessee’s healthcare.gov Marketplace in 2019 filed their proposed plans and prices with state regulators this week. Here are our top 3 takeaways based on the plans as submitted.
Note: About 3.5% of Tennesseans use these plans, which are sold through Marketplaces set up by the Affordable Care Act (also known as the ACA or Obamacare). Plan details could change, and we’ll know final plans and rates by late September. Open enrollment will run from November 1 to December 15, 2018.
Update: One month after we published this brief, WPLN reported that “rates for individual health insurance plans in Tennessee will drop even more than expected next year, after the Trump Administration reversed plans for cutting payments to insurance companies.”
Key Takeaways
- Expect premiums for many popular plans to fall in all 95 counties next year.
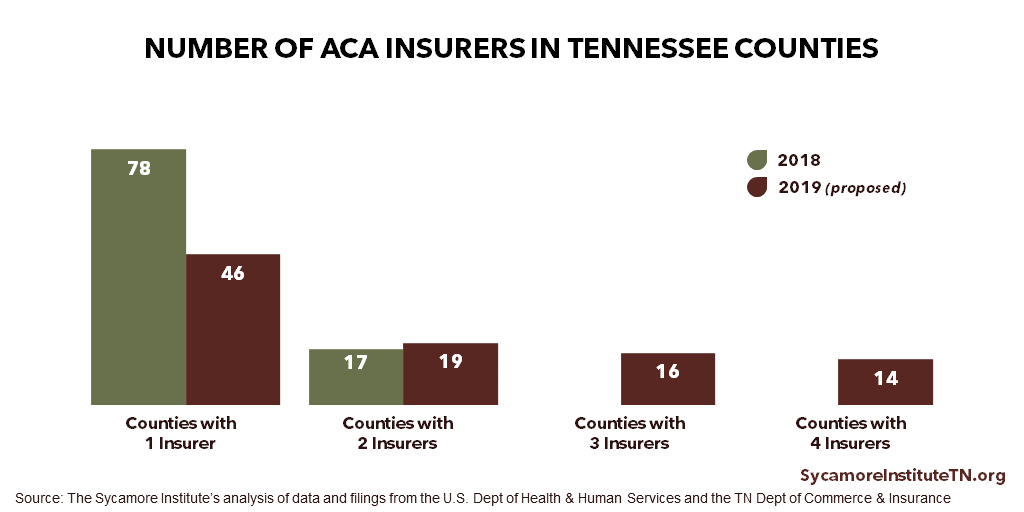
- 41 counties in the 4 largest metro areas will see more insurer competition, but almost half of counties will continue to have 1 insurer.
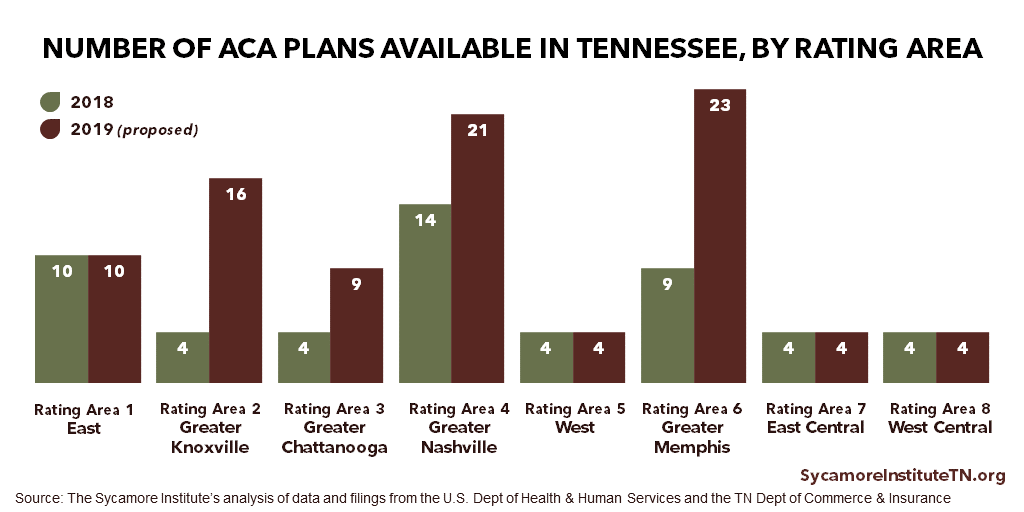
- The number of plans available will remain steady or increase in every county.
1. Expect Premiums for Many Popular Plans to Fall in Every County.
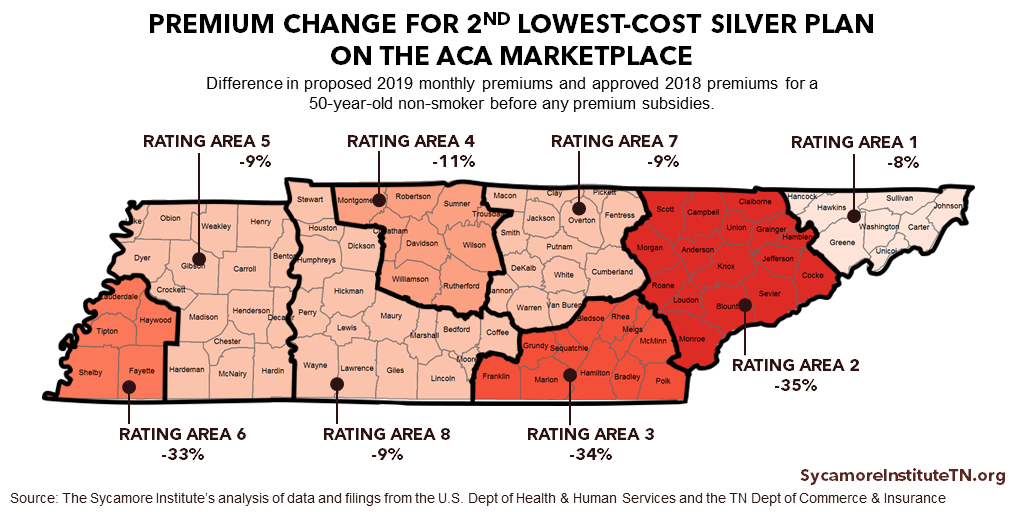
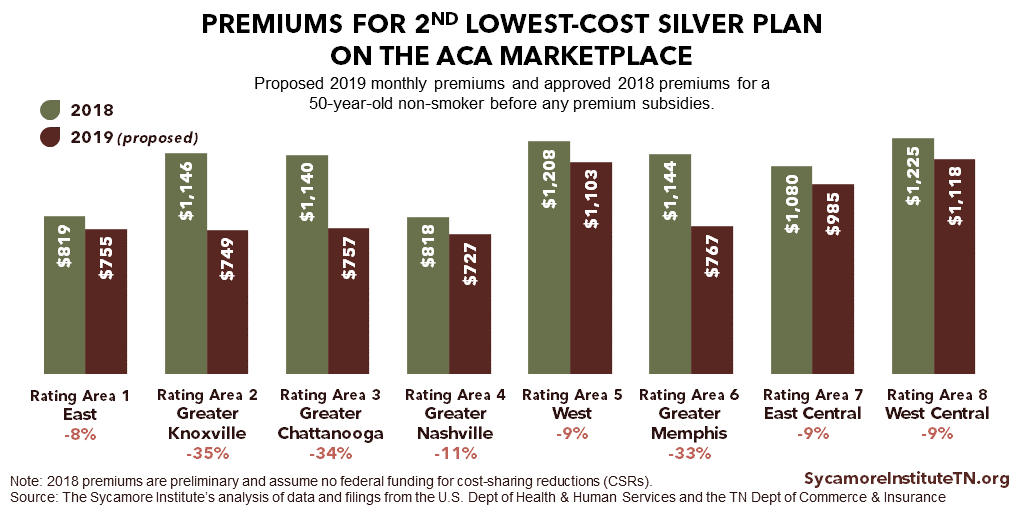
Premiums (before subsidies) for one of the Marketplace’s most popular plans are expected to fall in every county (Figures 1 and 2). The proposed drop in premiums for the 2nd lowest-cost silver plan ranges from -8% in the East rating area to -35% in the Greater Knoxville area. The 2nd lowest-cost silver plans are the benchmark for premium subsidies, which 84% of Tennessee enrollees received in 2018.
Figure 1
Figure 2
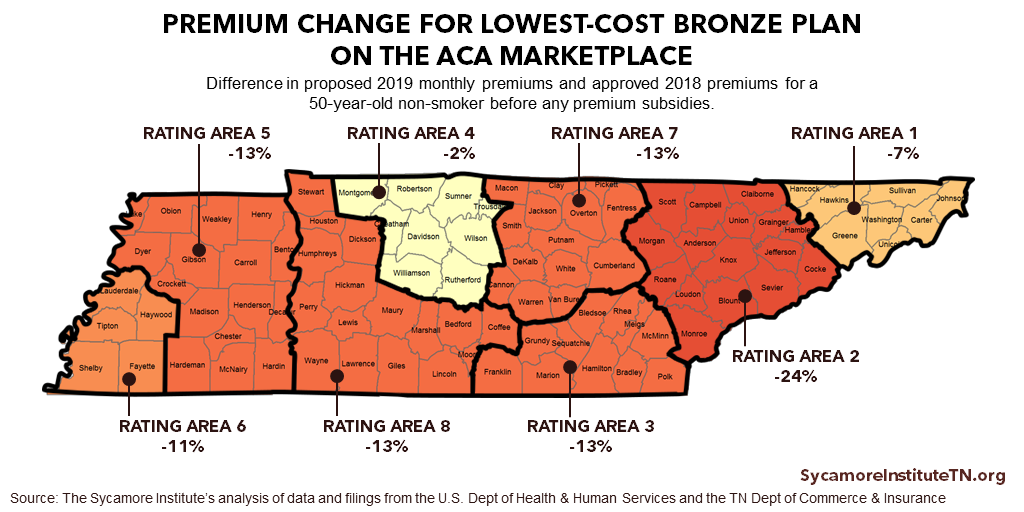
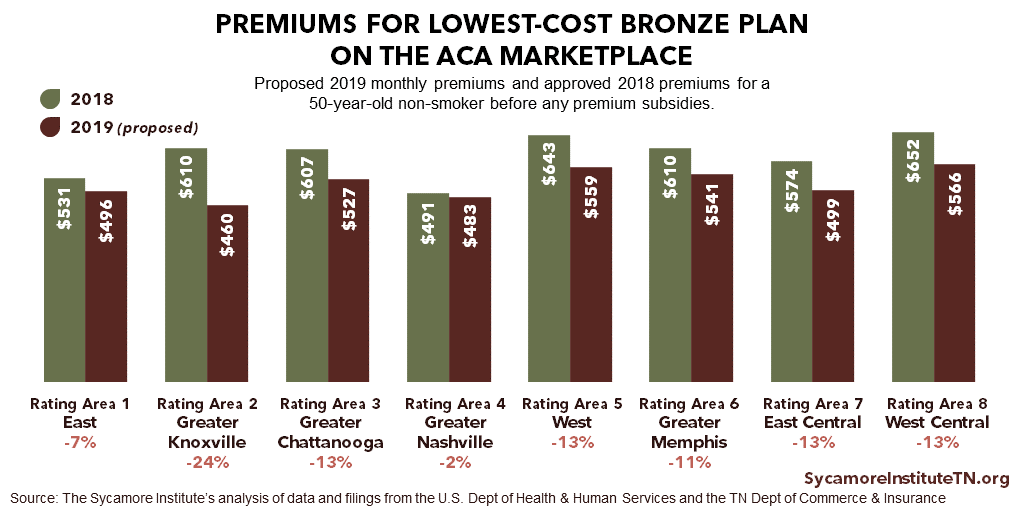
The lowest-cost premiums in the Marketplace are also expected to drop (Figures 3 and 4). As premiums have risen in recent years, bronze plans have become increasingly popular, particularly among unsubsidized enrollees. The proposed drop in premiums for the lowest-cost bronze plan ranges from -2% in the Greater Nashville rating area to ‑24% in the Greater Knoxville area.
Figure 3
Figure 4
2. 41 Counties in the 4 Largest Metro Areas Could See More Competition, But Nearly Half Will Continue to Have 1 Insurer.
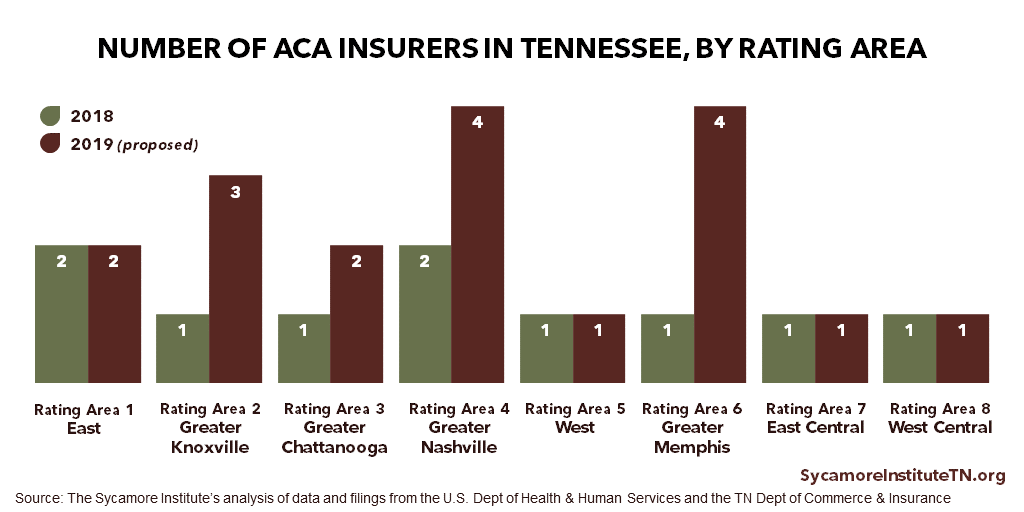
Based on the filings, enrollees in 4 rating areas covering 41 counties will have more insurers to choose from next year (Figure 5). Those 4 rating areas include the Nashville, Memphis, Knoxville, and Chattanooga areas. A total of 5 insurers plan to participate across the state — including 2 new entrants Celtic (also known as Ambetter or Centene) and Bright. Meanwhile, existing insurers Cigna and Oscar intend to expand into new areas.
Almost half of Tennessee counties, many of them rural, will continue to have only 1 participating insurer (Figure 6). Blue Cross Blue Shield of Tennessee is the only participating insurer in the West, East Central, and West Central rating areas, covering 46 counties.
Figure 5
Figure 6
3. Plan Choice Will Remain Steady or Increase in All Counties.
Enrollees in 41 counties around the 4 largest metro areas will also have more plan options in 2019 (Figure 7), while the number will remain the same in 54 counties. Plan options range from 4 plans in the West, East Central, and West Central rating areas to as many as 23 in the Greater Memphis area.
Figure 7
Related Work by The Sycamore Institute
2 Reasons TN’s Obamacare Premiums Might Stabilize in 2019 and 1 Reason They May Not
(May 17, 2018) Explains what might happen with healthcare.gov Marketplace premium rates for 2019 using the available evidence.
Tennessee’s 2018 Obamacare Enrollment
(April 13, 2018) analyzes detailed federal data on enrollment in Tennessee’s 2018 Marketplace and compares 2018 to prior years.
County-Level Data on Tennessee’s 2018 Obamacare Enrollment
(April 19, 2018) Includes maps, charts, and tables showing how key data about 2018 Marketplace enrollment vary by county.
Click here for all Affordable Care Act (ACA)-related posts by The Sycamore Institute.
References
Click to Open/Close
- U.S. Department of Health and Human Services (HHS). 2018 QHP Landscape Data. [Online] 2018. [Accessed on July 9, 2018.] Accessed from https://www.healthcare.gov/health-plan-information-2018/.
- Tennessee Department of Commerce and Insurance (TDCI). 2019 Rate Filings for Individual Market Major Medical Coverage (H16I). SERFF Filing Access. [Online] July 11, 2018. [Accessed on July 12, 2017.] Accessed via https://filingaccess.serff.com/sfa/home/TN.
*This post was updated on July 13, 2018 to correct a sentence indicating which rating area will see the largest percentage drop in premiums for the lowest-cost bronze plan and on August 28, 2018 to correct a miscalculation of the number of counties with 1 and 2 insurers.

