Last week, we dug into statewide data on 2018 open enrollment in private health insurance through the healthcare.gov Marketplace created by the Affordable Care Act (ACA). The maps, charts, and tables below show how key data about 2018 Marketplace enrollment vary by county.
The following observations were notable in our analysis of the data, but the factors that might be driving them are not yet clear:
- Counties in Northeast Tennessee experienced the largest declines in enrollment from 2017 to 2018.
- The average net premium for subsidized enrollees is notably higher in the rating areas that include Davidson County and the Tri-Cities. Meanwhile, these same areas have some of the lowest premiums for the minority of enrollees who are unsubsidized.
Note: These county-level data are based on actual enrollment and plan selections during the 2018 open enrollment period that ran from November 1st to December 15th, 2017. Participating insurers, plan options and premium rates are based on 8 “rating areas” across the state, which are shown on the maps that follow.
Enrollment
- Tennessee’s most populous counties (i.e. Davidson, Shelby, Knox, and Hamilton) have the most enrollees. Just under 229,000 Tennesseans enrolled statewide in Marketplace coverage for 2018. (Figure 1)
- Enrollment ranges from 1.8% of population in Montgomery County to 5.1% in Sevier County. Statewide, Marketplace enrollment amounts to about 3.4% of the state’s total population. (Figure 2)
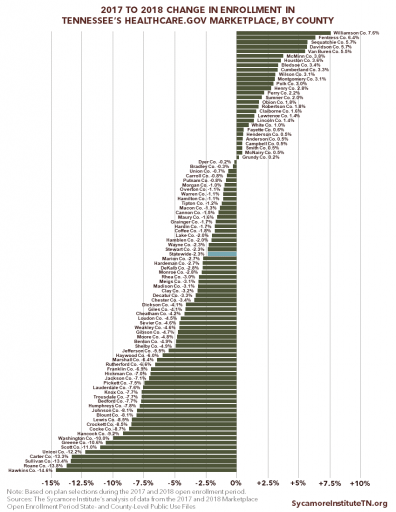
- Change in enrollment from 2017 to 2018 varies considerably — ranging from a 7.6% increase in Williamson County to a 14.6% decline in Hawkins County. Statewide enrollment was relatively stable with only a 2% drop from 2017. (Figures 3 and 4)
Figure 1
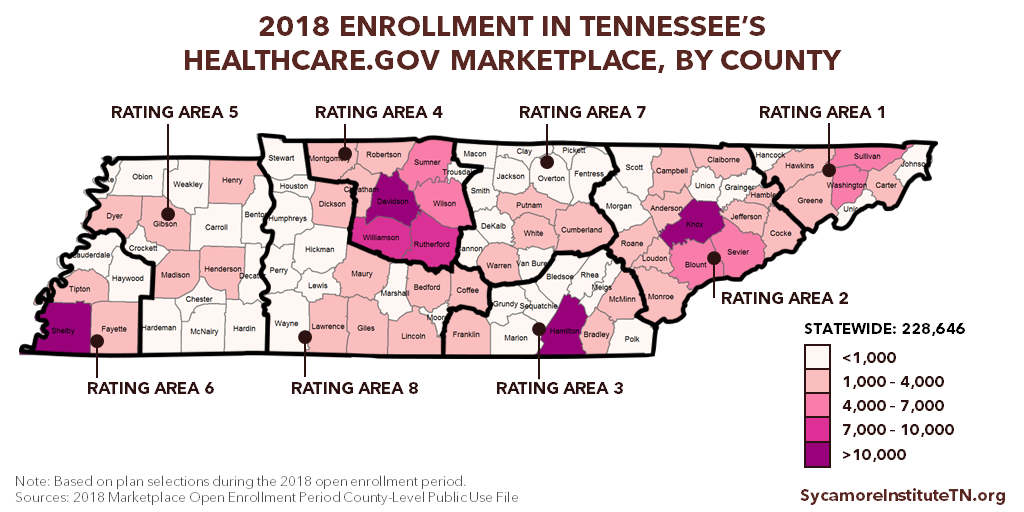
Figure 2
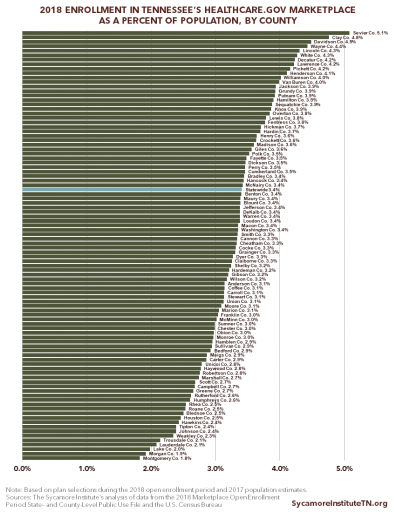
Figure 3
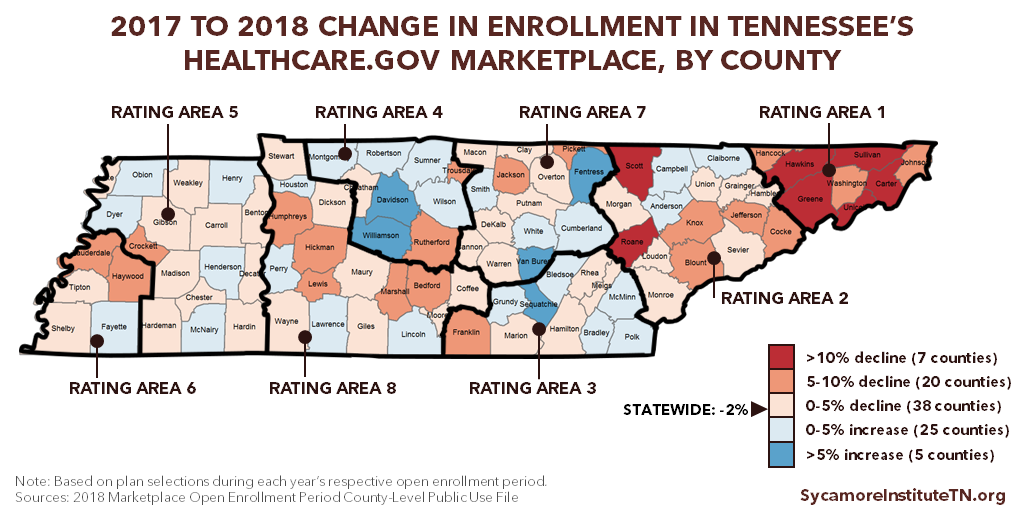
Figure 4
Subsidies
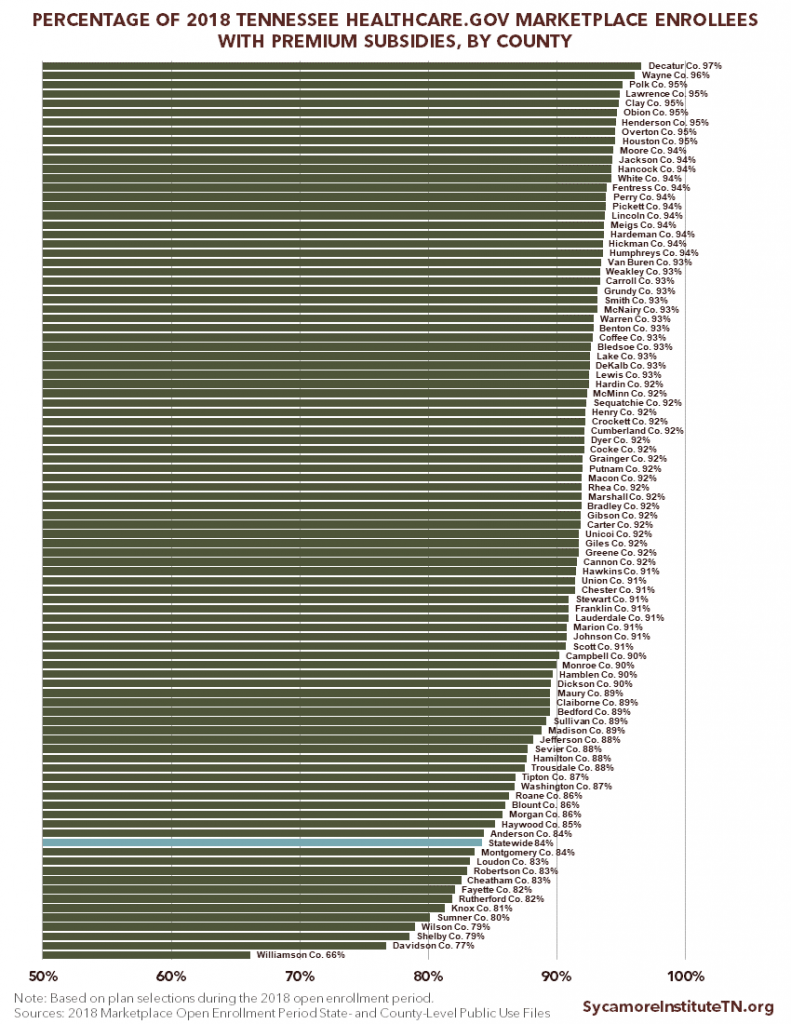
- The share of enrollees eligible for federal subsidies to offset premiums ranges from 66% in Williamson County to 97% in Decatur County. Statewide, about 84% of enrollees are eligible for federal premium subsidies. (Figures 5 and 6) These subsidies are available to those with incomes under 400% of poverty (about $48,560 for an individual in 2018).
- Average monthly premium subsidies range from $569 in Williamson County to $1,082 in Perry County, while growth in subsidies from 2017 to 2018 range from 21% in Bledsoe County to 95% in Loudon County. Statewide, average premium subsidies for eligible enrollees were $797 per month, a 51% increase over average subsidies in 2017. (Table 1, bottom of page) Because subsidies are available on a sliding scale, growth in average premium subsidies is driven by both premiums for the “benchmark” plan on which subsidies are based and the income levels of actual enrollees.
Figure 5

Figure 6
Premiums
- There is a wide range across counties in average monthly premiums for both subsidized and unsubsidized enrollees.
- Subsidized enrollees’ net average monthly premiums range from $12 in Haywood County to $74 in Cheatham and Johnson Counties. Statewide, this average amount is $39 per month, on average. (Figures 7 and 8)
- Unsubsidized enrollees’ average monthly premiums range from $514 in Davidson County to $1,007 in Houston County. Statewide, this average amount is $619 per month. (Figures 9 and 10)
County-level data on 2017 premiums are not available, which limits our ability to do county-level analysis of premium trends.
Figure 7
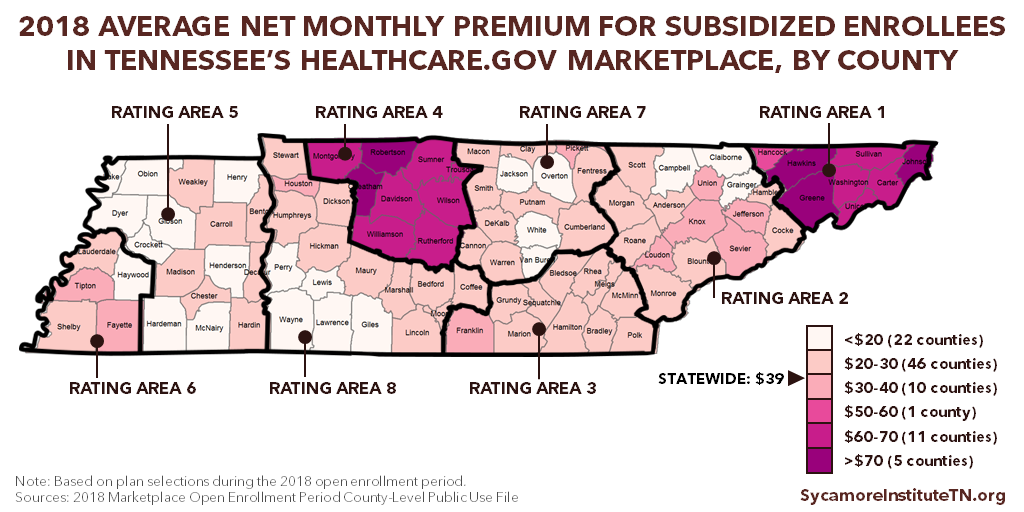
Figure 8
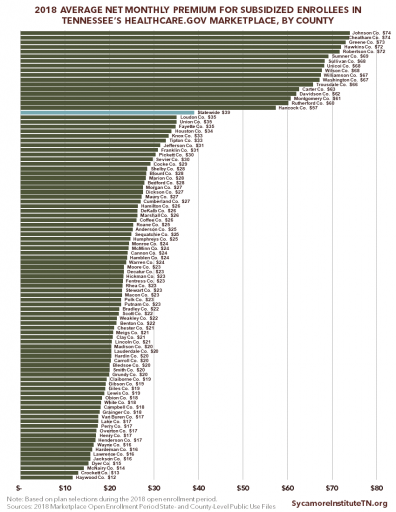
Figure 9
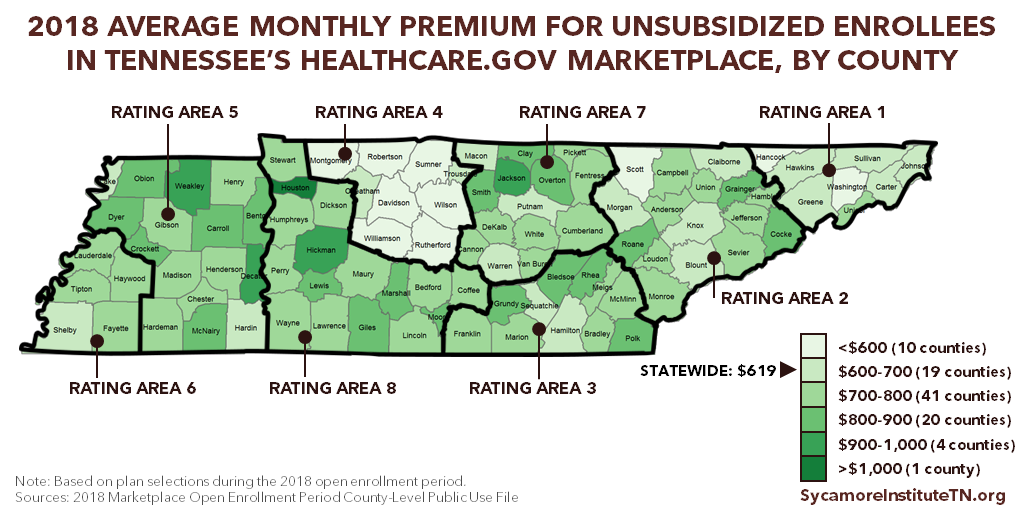
Figure 10

Table 1
Tennessee 2018 Healthcare.gov Marketplace Data by County
| 2018 Marketplace Enrollment | Enrollment as a % of 2017 Population | 2017 to 2018 Change in Enrollment | % of 2018 Enrollees with Premium Subsidies | Avg. Premium Subsidy | 2017 to 2018 Change in Avg. Premium Subsidy | 2018 Avg. Net Monthly Premium - Subsidized Enrollees | 2018 Avg. Net Monthly Premium - Unsubsidized Enrollees | |
|---|---|---|---|---|---|---|---|---|
| Tennessee | 228,646 | 3.4% | -2.3% | 84% | $797 | 51% | $39 | $619 |
| Anderson County | 2,396 | 3.1% | 0.5% | 84% | $883 | 79% | $25 | $722 |
| Bedford County | 1,408 | 2.9% | -7.7% | 89% | $951 | 34% | $28 | $763 |
| Benton County | 544 | 3.4% | -4.9% | 93% | $1,016 | 36% | $22 | $866 |
| Bledsoe County | 368 | 2.5% | 3.4% | 93% | $976 | 21% | $20 | $820 |
| Blount County | 4,401 | 3.4% | -8.1% | 86% | $881 | 87% | $28 | $699 |
| Bradley County | 3,638 | 3.4% | -0.3% | 92% | $875 | 31% | $22 | $700 |
| Campbell County | 1,061 | 2.7% | 0.5% | 90% | $958 | 80% | $18 | $736 |
| Cannon County | 474 | 3.3% | -1.5% | 92% | $865 | 33% | $24 | $770 |
| Carroll County | 872 | 3.1% | -0.8% | 93% | $993 | 30% | $20 | $872 |
| Carter County | 1,615 | 2.9% | -13.3% | 92% | $727 | 55% | $63 | $656 |
| Cheatham County | 1,342 | 3.3% | -4.2% | 83% | $691 | 44% | $74 | $650 |
| Chester County | 511 | 3.0% | -3.4% | 91% | $946 | 32% | $21 | $732 |
| Claiborne County | 1,028 | 3.3% | 1.6% | 89% | $930 | 77% | $19 | $639 |
| Clay County | 367 | 4.8% | -3.2% | 95% | $889 | 36% | $21 | $828 |
| Cocke County | 1,179 | 3.3% | -8.7% | 92% | $1,009 | 81% | $29 | $840 |
| Coffee County | 1,729 | 3.1% | -1.8% | 93% | $951 | 35% | $26 | $796 |
| Crockett County | 526 | 3.6% | -8.5% | 92% | $953 | 34% | $13 | $813 |
| Cumberland County | 2,044 | 3.5% | 3.3% | 92% | $924 | 34% | $27 | $741 |
| Davidson County | 30,994 | 4.5% | 5.7% | 77% | $574 | 40% | $62 | $514 |
| Decatur County | 497 | 4.2% | -3.3% | 97% | $989 | 31% | $23 | $960 |
| DeKalb County | 671 | 3.4% | -2.8% | 93% | $898 | 36% | $26 | $721 |
| Dickson County | 1,831 | 3.5% | -4.1% | 90% | $946 | 34% | $27 | $759 |
| Dyer County | 1,224 | 3.3% | -0.2% | 92% | $948 | 33% | $15 | $821 |
| Fayette County | 1,394 | 3.5% | 0.6% | 82% | $911 | 84% | $35 | $768 |
| Fentress County | 683 | 3.8% | 6.4% | 94% | $874 | 33% | $23 | $729 |
| Franklin County | 1,265 | 3.0% | -6.9% | 91% | $948 | 30% | $31 | $740 |
| Gibson County | 1,571 | 3.2% | -4.7% | 92% | $948 | 29% | $19 | $730 |
| Giles County | 1,047 | 3.6% | -4.1% | 92% | $995 | 35% | $19 | $894 |
| Grainger County | 765 | 3.3% | -1.7% | 92% | $980 | 82% | $18 | $838 |
| Greene County | 1,828 | 2.7% | -10.6% | 92% | $738 | 55% | $73 | $603 |
| Grundy County | 525 | 3.9% | 0.2% | 93% | $1,008 | 27% | $20 | $801 |
| Hamblen County | 1,895 | 2.9% | -2.0% | 90% | $913 | 83% | $24 | $730 |
| Hamilton County | 14,096 | 3.9% | -1.1% | 88% | $822 | 29% | $26 | $674 |
| Hancock County | 227 | 3.4% | -9.2% | 94% | $828 | n/a* | $57 | $543 |
| Hardeman County | 817 | 3.2% | -2.7% | 94% | $955 | 30% | $16 | $765 |
| Hardin County | 956 | 3.7% | -1.7% | 92% | $1,018 | 33% | $20 | $683 |
| Hawkins County | 1,373 | 2.4% | -14.6% | 91% | $761 | 55% | $72 | $636 |
| Haywood County | 487 | 2.8% | -6.0% | 85% | $975 | 82% | $12 | $755 |
| Henderson County | 1,141 | 4.1% | 0.5% | 95% | $920 | 33% | $17 | $772 |
| Henry County | 1,182 | 3.6% | 2.8% | 92% | $1,016 | 34% | $17 | $765 |
| Hickman County | 921 | 3.7% | -7.0% | 94% | $989 | 33% | $23 | $902 |
| Houston County | 202 | 2.5% | 3.6% | 95% | $993 | 24% | $34 | $1,007 |
| Humphreys County | 482 | 2.6% | -7.8% | 94% | $961 | 32% | $25 | $772 |
| Jackson County | 460 | 3.9% | -7.1% | 94% | $957 | 37% | $16 | $919 |
| Jefferson County | 1,819 | 3.4% | -5.5% | 88% | $934 | 82% | $31 | $722 |
| Johnson County | 422 | 2.4% | -8.1% | 91% | $775 | 56% | $74 | $621 |
| Knox County | 17,856 | 3.9% | -7.7% | 81% | $819 | 87% | $33 | $631 |
| Lake County | 148 | 2.0% | -2.0% | 93% | $1,008 | n/a* | $17 | $681 |
| Lauderdale County | 526 | 2.1% | -7.6% | 91% | $927 | 79% | $20 | $757 |
| Lawrence County | 1,832 | 4.2% | 1.4% | 95% | $974 | 33% | $16 | $715 |
| Lewis County | 455 | 3.8% | -8.5% | 93% | $1,015 | 29% | $19 | $867 |
| Lincoln County | 1,453 | 4.3% | 1.4% | 94% | $961 | 34% | $21 | $750 |
| Loudon County | 1,761 | 3.4% | -4.5% | 83% | $936 | 95% | $35 | $722 |
| McMinn County | 1,594 | 3.0% | 3.8% | 92% | $911 | 29% | $24 | $716 |
| McNairy County | 889 | 3.4% | 0.5% | 93% | $955 | 29% | $14 | $805 |
| Macon County | 807 | 3.4% | -1.3% | 92% | $886 | 33% | $23 | $673 |
| Madison County | 3,510 | 3.6% | -3.1% | 89% | $901 | 34% | $20 | $715 |
| Marion County | 868 | 3.1% | -2.7% | 91% | $947 | 30% | $28 | $756 |
| Marshall County | 902 | 2.7% | -6.4% | 92% | $945 | 31% | $26 | $804 |
| Maury County | 3,123 | 3.4% | -1.6% | 89% | $891 | 33% | $27 | $741 |
| Meigs County | 346 | 2.9% | -3.1% | 94% | $945 | 26% | $21 | $745 |
| Monroe County | 1,373 | 3.0% | -2.8% | 90% | $977 | 79% | $24 | $781 |
| Montgomery County | 3,647 | 1.8% | 3.1% | 84% | $631 | 38% | $61 | $545 |
| Moore County | 197 | 3.1% | -4.8% | 94% | $979 | 36% | $23 | $842 |
| Morgan County | 415 | 1.9% | -1.0% | 86% | $990 | 81% | $27 | $673 |
| Obion County | 903 | 3.0% | 1.8% | 95% | $965 | 30% | $18 | $813 |
| Overton County | 846 | 3.8% | -1.1% | 95% | $872 | 29% | $17 | $828 |
| Perry County | 276 | 3.5% | 2.2% | 94% | $1,082 | 33% | $17 | $759 |
| Pickett County | 211 | 4.2% | -7.5% | 94% | $931 | 36% | $30 | $729 |
| Polk County | 590 | 3.5% | 3.0% | 95% | $961 | 29% | $23 | $869 |
| Putnam County | 3,045 | 3.9% | -0.8% | 92% | $789 | 35% | $23 | $620 |
| Rhea County | 829 | 2.5% | -3.0% | 92% | $938 | 29% | $23 | $819 |
| Roane County | 1,342 | 2.5% | -13.8% | 86% | $924 | 86% | $25 | $827 |
| Robertson County | 1,932 | 2.8% | 1.8% | 83% | $659 | 39% | $72 | $593 |
| Rutherford County | 8,305 | 2.6% | -6.6% | 82% | $596 | 43% | $60 | $523 |
| Scott County | 590 | 2.7% | -11.0% | 91% | $938 | 89% | $22 | $598 |
| Sequatchie County | 571 | 3.9% | 5.7% | 92% | $922 | 29% | $25 | $625 |
| Sevier County | 4,961 | 5.1% | -4.6% | 88% | $897 | 85% | $30 | $704 |
| Shelby County | 30,340 | 3.2% | -4.9% | 79% | $820 | 80% | $28 | $669 |
| Smith County | 656 | 3.3% | 0.5% | 93% | $888 | 33% | $20 | $815 |
| Stewart County | 418 | 3.1% | -2.3% | 91% | $1,018 | 34% | $23 | $718 |
| Sullivan County | 4,626 | 2.9% | -13.4% | 89% | $705 | 56% | $68 | $615 |
| Sumner County | 5,483 | 3.0% | 2.0% | 80% | $629 | 42% | $69 | $552 |
| Tipton County | 1,465 | 2.4% | -1.2% | 87% | $860 | 84% | $33 | $758 |
| Trousdale County | 216 | 2.1% | -7.7% | 88% | $718 | 39% | $66 | $632 |
| Unicoi County | 495 | 2.8% | -12.2% | 92% | $766 | 56% | $68 | $722 |
| Union County | 607 | 3.1% | -0.7% | 91% | $965 | 83% | $35 | $728 |
| Van Buren County | 229 | 4.0% | 5.5% | 93% | $945 | 31% | $17 | $752 |
| Warren County | 1,374 | 3.4% | -1.1% | 93% | $876 | 37% | $24 | $678 |
| Washington County | 4,282 | 3.4% | -10.0% | 87% | $668 | 60% | $67 | $590 |
| Wayne County | 734 | 4.4% | -2.3% | 96% | $1,016 | 33% | $16 | $727 |
| Weakley County | 782 | 2.3% | -4.6% | 93% | $946 | 29% | $22 | $926 |
| White County | 1,142 | 4.3% | 1.0% | 94% | $867 | 32% | $18 | $780 |
| Williamson County | 9,087 | 4.0% | 7.6% | 66% | $569 | 44% | $67 | $519 |
| Wilson County | 4,329 | 3.2% | 3.1% | 79% | $646 | 41% | $68 | $549 |
| 2018 Marketplace Enrollment | Enrollment as a % of 2017 Population | 2017 to 2018 Change in Enrollment | % of 2018 Enrollees with Premium Subsidies | Avg. Premium Subsidy | 2017 to 2018 Change in Avg. Premium Subsidy | 2018 Avg. Net Monthly Premium - Subsidized Enrollees | 2018 Avg. Net Monthly Premium - Unsubsidized Enrollees |
*Average premium subsidy data for 2017 are unavailable for Hancock and Lake Counties.
Note: Based on plan selections during the 2017 and 2018 open enrollment periods.
Sources: The Sycamore Institute’s analysis of data from the 2018 Marketplace Open Enrollment Period State- and County-Level Public Use Files and the U.S. Census Bureau (3) (4) (1) (2) (3)
Related Work by The Sycamore Institute
Tennessee’s 2018 Obamacare Enrollment
(April 13, 2018) Analyzes statewide data on 2018 Marketplace enrollment and premiums.
CSR Payments, Uncertainty, and Tennessee’s 2017 ACA Marketplace
(September 29, 2017) Analyzes 2018 Marketplace premiums and explains cost-sharing reduction payments and what they might mean for Tennessee.
Health Insurance Markets 101 – Key Concepts that Influence Access and Affordability
(April 5, 2017) Discusses key health insurance terms and concepts that influence insurance access and affordability (e.g. risk pooling)
Health Insurance Coverage in Tennessee in 2016
(October 5, 2017) Analyzes the most recent data on the rate of the uninsured and where insured Tennessean’s get health coverage.
Click here for all Affordable Care Act (ACA)-related posts by The Sycamore Institute.
References
Click to Open/Close
- Centers for Medicare and Medicaid Services. 2018 Marketplace Open Enrollment Period State-Level Public Use File. U.S. Department of Health and Human Services. [Online] April 3, 2018. [Accessed on April 4, 2018.] Accessed via https://www.cms.gov/Research-Statistics-Data-and-Systems/Statistics-Trends-and-Reports/Marketplace-Products/2018_Open_Enrollment.html.
- —. 2018 Marketplace Open Enrollment Period County-Level Public Use File. U.S. Department of Health and Human Services. [Online] April 2018. [Accessed on April 17, 2018.] Accessed via https://www.cms.gov/Research-Statistics-Data-and-Systems/Statistics-Trends-and-Reports/Marketplace-Products/2018_Open_Enrollment.html.
- —. 2017 Marketplace Open Enrollment Period State-Level Public Use File. U.S. Department of Health and Human Services. [Online] May 11, 2017. [Accessed on April 4, 2018.] Accessed via https://www.cms.gov/Research-Statistics-Data-and-Systems/Statistics-Trends-and-Reports/Marketplace-Products/Plan_Selection_ZIP.html.
- —. 2017 Marketplace Open Enrollment Period County-Level Public Use File. U.S. Department of Health and Human Services. [Online] May 11, 2017. [Accessed on April 17, 2018.] Accessed via https://www.cms.gov/Research-Statistics-Data-and-Systems/Statistics-Trends-and-Reports/Marketplace-Products/Plan_Selection_ZIP.html.
- U.S. Census Bureau, Population Division. Annual Estimates of the Resident Population: April 1, 2010 to July 1, 2017 . [Online] March 2018. [Accessed on April 17, 2018.] Accessed via https://factfinder.census.gov/bkmk/table/1.0/en/PEP/2017/PEPANNRES/0400000US47|0400000US47.05000.