All public policy decisions have trade-offs. As they weigh these trade‑offs, state policymakers may want to consider how budget and economic policies affect the health and well‑being of Tennesseans and, in turn, how Tennesseans’ health and well‑being affects our prosperity. This section of Healthy Debate 2018 outlines several ways public policy impacts public health, the specific parts of the budget directly related to health, and the economic cost of chronic disease in Tennessee.
How Public Policy Impacts Tennesseans’ Health
Public policy is the system of laws, regulatory measures, courses of action (or inaction), and funding priorities implemented by a government entity or its representatives. While many debate the proper size and role of government, public policies play an important role in Tennesseans’ daily lives.
Just as health encompasses more than health care, the realm of health policy extends beyond health care policy. Public policies that do not initially appear health-related can have a significant health impact due to their effects on the drivers of health.
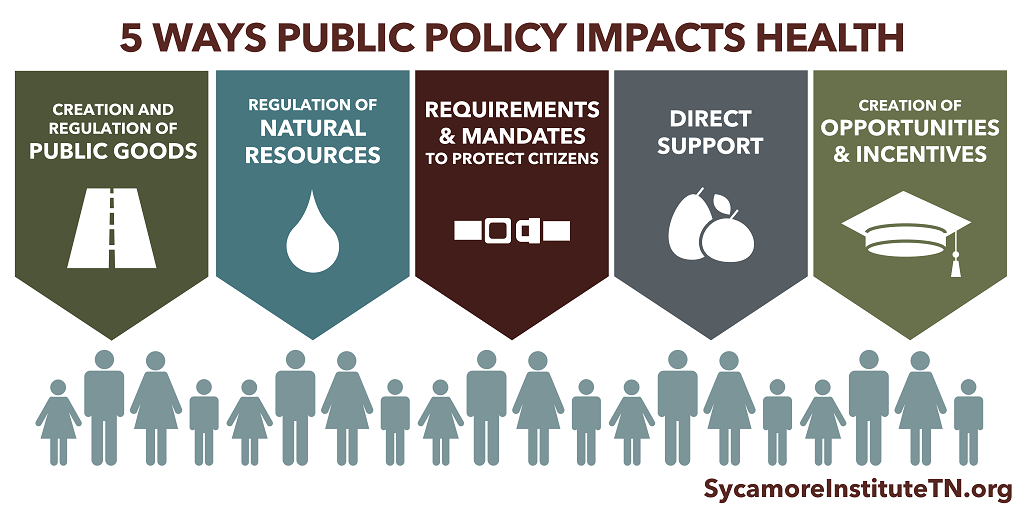
Tennessee’s public policies, programs, and services shape and influence our physical, social, and economic environments and influence our behaviors by:
- Creating, regulating, and maintaining public goods.
- Regulating natural resources.
- Setting requirements and mandates.
- Providing direct support in ways that affect the drivers of health.
- Reducing barriers, creating opportunities, or providing incentives that influence the choices that impact health.
For example, anyone can use our state roads and highways, which are funded by taxes and user fees. How we plan, build, connect, and maintain these roads affects the accessibility of needed services and the walkability of our communities. Research shows that these factors can create opportunities (or barriers) to getting the care and making the choices that keep people healthy.
Another example —Tennessee’s HOPE scholarships are designed to reduce financial barriers and give some Tennessee students the opportunity to attend college. Research shows that education and income are the greatest predictors of health. Individuals with higher levels of education and income tend to live longer, healthier lives.
Health in the Tennessee State Budget
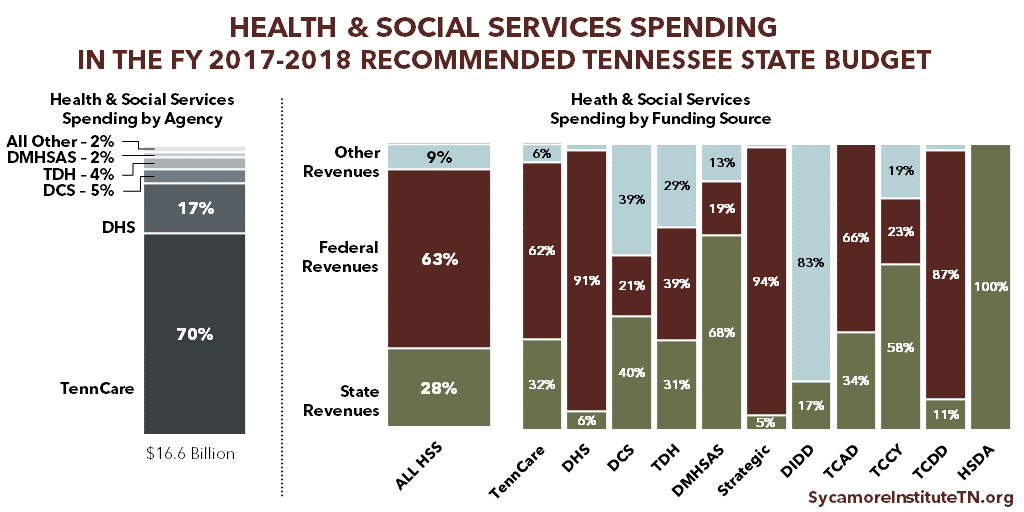
“Health & Social Services” is the largest category of spending in the state budget. It includes the following agencies: (2)
- Division of Health Care Finance and Administration / TennCare ($11.6 billion)
- Department of Human Services (DHS) ($2.9 billion)
- Department of Children’s Services (DCS) ($783 million)
- Department of Health (TDH) ($624 million)
- Department of Mental Health & Substance Abuse Services (TDMHSAS) ($355 million)
- Department of Finance and Administration Strategic Health Care Programs ($234 million)
- Department of Intellectual and Developmental Disabilities (DIDD) ($142 million)
- Tennessee Commission on Aging and Disability (TCAD) ($43 million)
- Tennessee Commission on Children and Youth (TCCY) ($5 million)
- Tennessee Council on Developmental Disabilities (TCDD) ($2 million)
- Health Services and Development Agency (HSDA) ($1 million)
Source: Citation (1) in References and Notes
Funding for health and social services agencies comes predominantly from federal dollars. The lion’s share goes to 2 programs: TennCare (Tennessee’s state Medicaid program) and the Supplemental Nutrition Assistance Program (SNAP) within DHS. The combined $9.1 billion in federal dollars for these 2 programs accounts for 67% of all federal money flowing into the state budget and 1/4 of the entire state budget. (3)
While these programs provide services that explicitly address health and well-being, other areas of the state budget also influence health and the drivers of health.
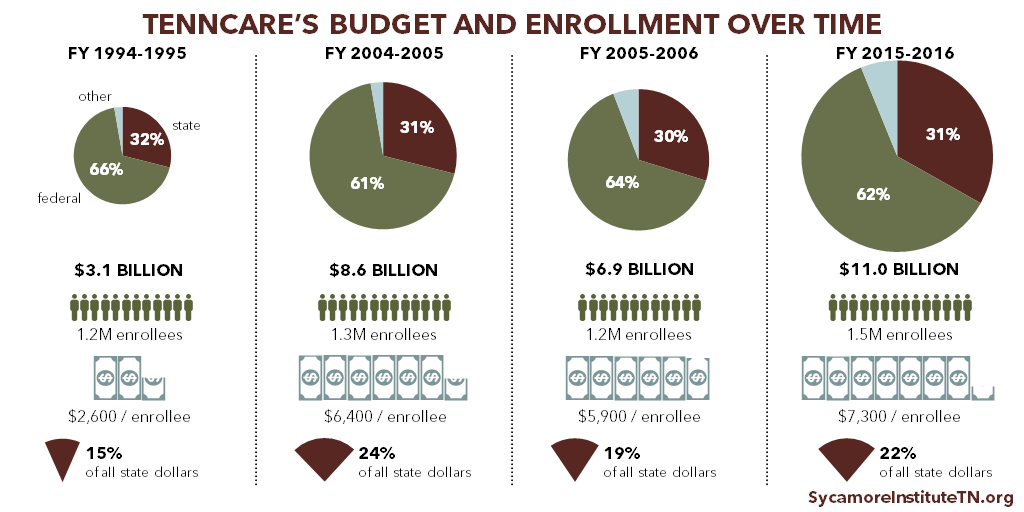
TennCare and the State Budget
TennCare, Tennessee’s state Medicaid program, is the single largest agency in the state budget and provides health coverage to 1 in 5 Tennesseans. (5) Many health and budget policy issues in Tennessee require a firm understanding of Medicaid and TennCare.
Source: Citation (4) in References and Notes
Each state runs its own Medicaid program according to federal rules that govern what benefits must be offered and to whom. Medicaid is a federal entitlement, which means that spending is largely determined by how many people enroll and how much their benefits cost. The federal government pays a specific portion of these costs in each state, and the state pays the rest. In Tennessee, the federal medical assistance percentage (FMAP) is nearly 66% in federal FY 2018. Lower income states have higher FMAPs, and Tennessee’s FMAP is currently the 14th highest in the country. (6)
TennCare costs can be difficult to predict because Medicaid is an entitlement program. Coverage of many treatments is guaranteed to all who are eligible — even when treatment costs or the number of enrollees spikes due to rising health care costs or economic downturns. This makes states’ costs relatively hard to predict, which can affect other parts of a state budget. Tennessee’s relatively high FMAP partially shields the state from unpredictable cost spikes.
Policymakers often inquire about TennCare’s efficiency, which can be measured in several ways. For example, Tennessee’s total Medicaid spending grew slower than most other states’ between 2011 and 2016, including those that have not expanded Medicaid. (7) On a per-enrollee basis, however, Tennessee’s spending grew faster than most other states between 2011 and 2014 (the most recent year for which data across states are available). (8)
Tennessee has not expanded Medicaid eligibility under the Affordable Care Act (ACA), which would make about 250,000 uninsured Tennesseans under 138% of poverty newly eligible for TennCare. (9) As many as 163,000 of those individuals have incomes below poverty and do not qualify for subsidies for private insurance via healthcare.gov. (10) The ACA mandated Medicaid coverage for these individuals, but a 2012 U.S. Supreme Court decision made expansion optional. Insure Tennessee, Governor Haslam’s unsuccessful 2015 expansion plan, proposed to pay the state’s share of expansion costs (6% in 2018 growing to 10% in 2020) with an assessment on hospitals. The Three Star Healthy Task Force appointed by Speaker Harwell in 2016 to explore other options has not released a formal proposal.
Today, TennCare primarily serves populations required by federal law. These include low-income individuals in one of the following categories: children, pregnant women, parents or caregiver relatives, seniors, and individuals with disabilities. Childless adults without disabilities — those most likely to be affected by other states’ proposed Medicaid work requirements — are largely ineligible for TennCare because the state has not expanded Medicaid under the ACA.
The Economic Cost of Chronic Disease in Tennessee
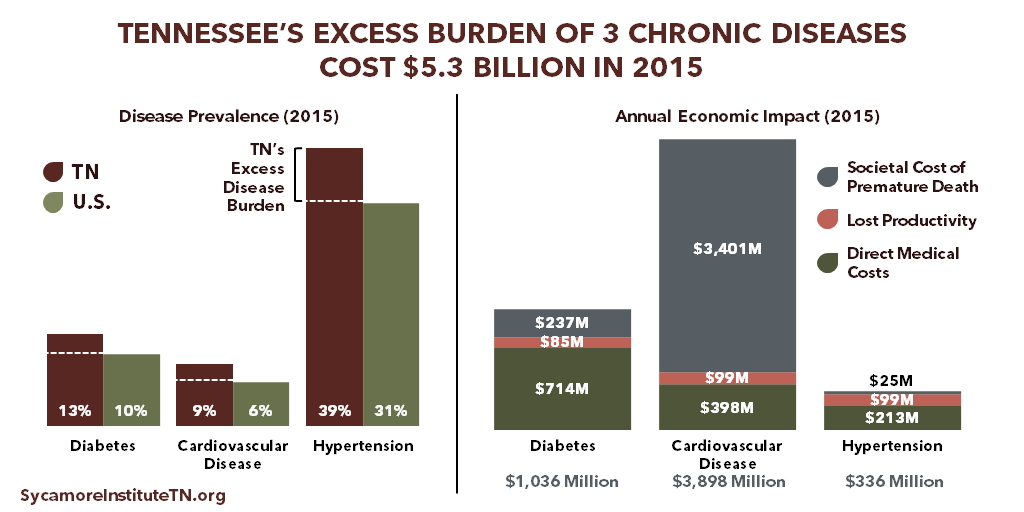
Higher rates of chronic disease in Tennessee have a cost — including higher health care expenditures, lost productivity, and premature death. A November 2017 study by The Sycamore Institute estimated the economic impact that achieving aspirational-but-realistic reductions in the prevalence of 3 chronic conditions might have on our state. (11) According to the study:
- Diabetes, cardiovascular disease (CVD), and hypertension affected 460,000 additional Tennesseans in 2015 due to state prevalence rates exceeding the national rates.
- The excess burden of these 3 diseases alone cost Tennessee nearly $5.3 billion in 2015 in direct medical care, lost productivity, and premature death. Excess rates of diabetes cost an estimated $1.0 billion, CVD $3.9 billion, and hypertension $336 million.
Implications for Tennessee’s Taxpayers, Businesses, and Economy
Tennesseans’ health and our state’s economy have a complex and mutually influential relationship. Economic growth and prosperity are among the many factors that influence Tennesseans’ health and well-being. Our study begins to quantify and shed light on one important way that Tennesseans’ health and well-being also affect our economy.
Tennessee’s higher-than-average burden of chronic disease drives up health care costs in taxpayer-funded programs like TennCare, our state’s Medicaid program. Improving Tennesseans’ health could free up limited state taxpayer resources for other policy priorities like state tax reductions or increased spending in other areas.
Tennessee’s relatively high burden of chronic disease also raises employers’ costs for health care and productivity loss. Improving Tennesseans’ health could save employers money and increase their productivity, which could lead to higher wages and greater economic output for the state. Research suggests that workers’ health gains also increase their coworkers’ productivity, generating even larger economic gains.
*This document was updated on Jan. 11, 2018 to include additional information about TennCare
Related Work by The Sycamore Institute
5 Ways Public Policy Impacts Health
May 2017
Understanding Medicaid and TennCare: Key Concepts and Context to Know
June 2017
Medicaid Eligibility in Tennessee
August 2017
Medicaid Work Requirements in Tennessee
September – December 2017
The Economic Impact of Chronic Disease in Tennessee
November 2017
References and Notes
Click to Open/Close
- The Sycamore Institute’s analysis of the FY 2017-2018 Tennessee State Budget (pages A-17 – A-22)
- The FY 2017-2018 Tennessee State Budget (page A-17 – A-22)
- The Sycamore Institute’s analysis of the FY 2017-2018 Tennessee State Budget (pages A-17 – A-22, B-181)
- The Sycamore Institute’s analysis of the FY 1996-1997 – FY 2017-2018 Tennessee State Budgets and TennCare Historical Expenditure and Enrollment Data (https://www.tn.gov/content/dam/tn/tenncare/documents/historicalchart.pdf).
- 2016 American Community Survey (accessed on October 27 via https://www.census.gov/data/tables/time-series/demo/health-insurance/acs-hi.html)
- Kaiser Family Foundation’s state FMAP data for FY 2018 (accessed on October 4, 2017 via https://www.kff.org/medicaid/state-indicator/federal-matching-rate-and-multiplier/?currentTimeframe=0&sortModel=%7B%22colId%22:%22FMAP%20Percentage%22,%22sort%22:%22desc%22%7D)
- The Sycamore Institute’s analysis of National Association of State Budget Officers’ State Expenditure Reports from 2013-2016 (accessed via https://www.nasbo.org/mainsite/reports-data/state-expenditure-report)
- The Sycamore Institute’s analysis of the Kaiser Family Foundation’s data on per enrollee Medicaid spending across states for federal fiscal years 2011 and 2014 (https://www.kff.org/medicaid/issue-brief/data-note-variation-in-per-enrollee-medicaid-spending-across-states/
- The Kaiser Family Foundation estimates 271,000 (https://www.kff.org/uninsured/issue-brief/the-coverage-gap-uninsured-poor-adults-in-states-that-do-not-expand-medicaid/) and the Urban Institute estimates 238,000 (https://www.urban.org/sites/default/files/publication/82786/2000866-What-if-More-States-Expanded-Medicaid-in-2017-Changes-in-Eligibility-Enrollment-and-the-Uninsured.pdf).
- The Kaiser Family Foundation (https://www.kff.org/uninsured/issue-brief/the-coverage-gap-uninsured-poor-adults-in-states-that-do-not-expand-medicaid/)
- The Sycamore Institute’s 2017 analysis of the economic cost of chronic disease in Tennessee (https://www.sycamoreinstitutetn.org/cost-chronic-disease-tennessee/)