Tennessee’s budget is one of the most significant pieces of public policy our governor and General Assembly propose and enact every year. It represents the goals our state policymakers want to achieve, the public goods and services intended to help meet those goals, and detailed plans for how to finance them.
The Sycamore Institute’s Tennessee State Budget Primer provides detailed information on the state budget process, historical lookbacks, and the difficult trade-offs policymakers face in making budget decisions. This section of Healthy Debate 2018 summarizes key pieces of the Budget Primer and lays out a new governor’s immediate budget responsibilities.
Tennessee’s Budget Process
The state’s budget is an accounting of all the money coming into and going out of the state government. It also represents a delicate balance where all the pieces work in concert to achieve public policy goals. Key elements of the state’s budget process include:
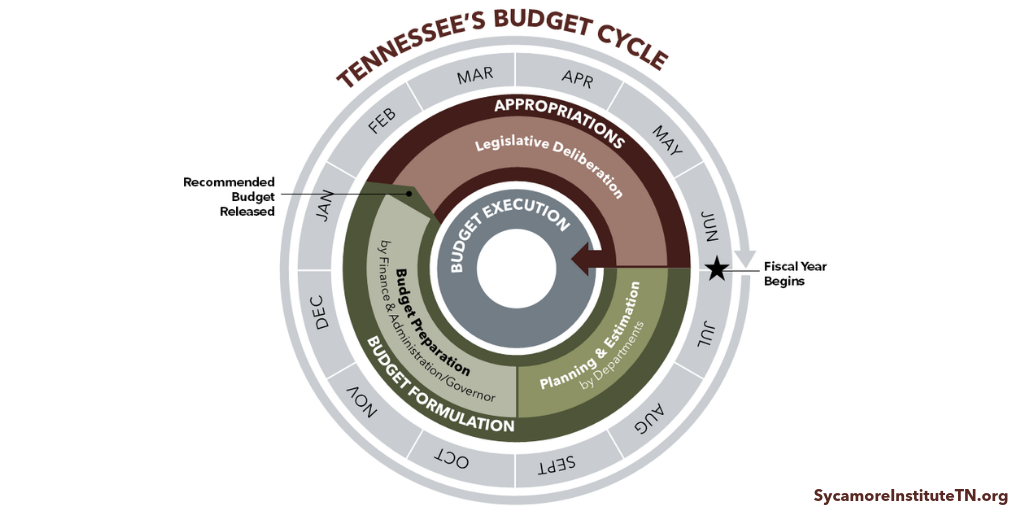
- The state’s fiscal year (FY) runs from July 1 to June 30. At any given time, policymakers in Tennessee’s legislative and/or executive branches are working on preparing, executing, or closing out up to 3 fiscal years.
- The state constitution requires a balanced budget. That means, in any given fiscal year, spending can’t exceed revenue collections + reserves. As a result, the budget is often dynamic — changing throughout both the planning and spending phases as the state’s revenue estimates change.
- The baseline for the governor’s budget recommendation to the legislature is the prior year’s recurring base budget. The governor’s recommendation serves as the starting point for the legislature’s work.
- To help with longer-term planning, the budget makes a distinction between recurring and non-recurring expenditures and revenues. However, Tennessee does not publish long-term estimates of revenue collections and potential spending needs.
- Lawmakers have limited discretion over a significant share of the budget’s revenues and expenditures. Issues that limit lawmakers’ ability to adjust the numbers can include federal matching requirements, entitlement program obligations, and court mandates. Only 18% of General Fund spending in FY 2016-2017 was considered discretionary for the purposes of formulating the FY 2017-2018 budget recommendation. (1)
- The legislature gives the executive branch flexibility to manage the budget and to spend less to keep the budget balanced. As a result, the “actual” numbers shown in the budget for the prior year do not always lend themselves to direct comparisons with the “estimated” current year and “recommended” upcoming year.
State Budget Revenues
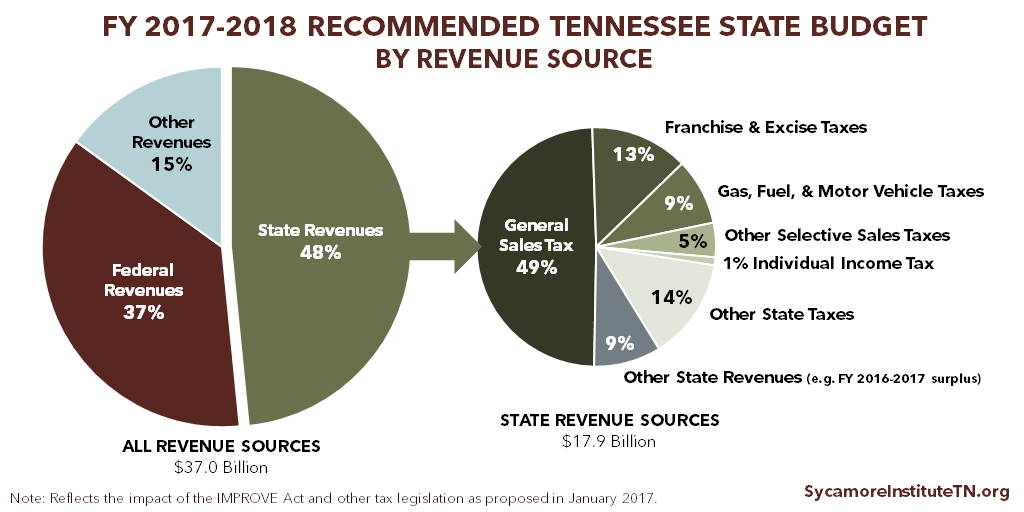
The revenue in the Tennessee state budget primarily comes from state revenue sources ($17.9 billion) and the federal government ($13.5 billion). (2)
State Tax Revenues
By most accounts, Tennessee is considered a low-tax state. The state collects about $2,300 per Tennessean to pay for the state’s programs and services — the 4th lowest per person tax load in the country. (3) (4)
In Tennessee, state revenues are predominately collected through general sales tax and the franchise and excise taxes ($8.8 billion or 49% and $2.4 billion or 13%, respectively, for FY 2017-2018). (5) Tennessee relies more on these two tax streams and less on individual income tax than do other states, on average. (6)
Under a balanced budget, revenue forecasts have a major influence on decisions about spending. Recent budget surpluses were the result of greater-than-forecasted growth in annual state tax collections. For this reason, the FY 2017‑2018 budget relied on a sizeable surplus from previous fiscal years. Historically, such large surpluses are an anomaly.
From 2011 to 2017, the General Assembly and Governor Haslam enacted over $771 million in annual, recurring tax cuts. These include -$323 million once the Hall Income Tax on investment income is phased out, ‑$171 million from reducing the general sales tax on groceries, -$119 million from modifying the franchise and excise taxes on businesses, ‑$111 million from repealing the inheritance and gift taxes, and -$47 million in other tax reductions. These cuts were partially offset by increases to transportation-related taxes and fees that will amount to $347 million once they are fully phased in on July 1, 2019. (7)
Federal Revenues
Tennessee relied more on federal dollars than all but 2 states in 2016 (Mississippi and Arizona). (8) The state currently relies less on federal funds than it did during the most recent recession, when federal revenues made up 44% of the state’s budget. (9)
These dollars represent only those in the state budget — not all federal dollars being spent to serve Tennesseans. In state FY 2015-2016, for example, the budget included $12.6 billion in federal funds, but in federal FY 2016, an estimated $73.9 billion in federal funds came to Tennessee via direct awards, contracts, and benefits. (10)
State Budget Expenditures
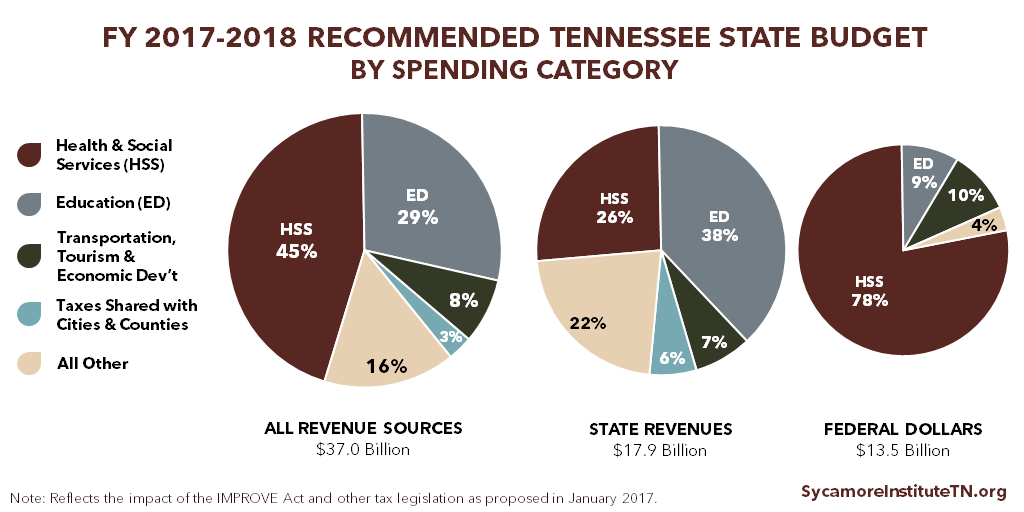
Health and social services ($16.6 billion) and education ($10.7 billion) account for about 3/4 of the state budget. (11) Different types of revenue, however, get spent in different ways. More state dollars are spent on education than on any other category, while most federal dollars are spent on health and social services.
Different programs and services also get funding from different revenue mixes. Funding for health and social services and transportation, tourism, and economic development programs and activities comes predominantly from federal dollars. Tennessee dollars account for most of the funding for education and law, safety, and corrections programs and activities.
Expenditure Growth Trends
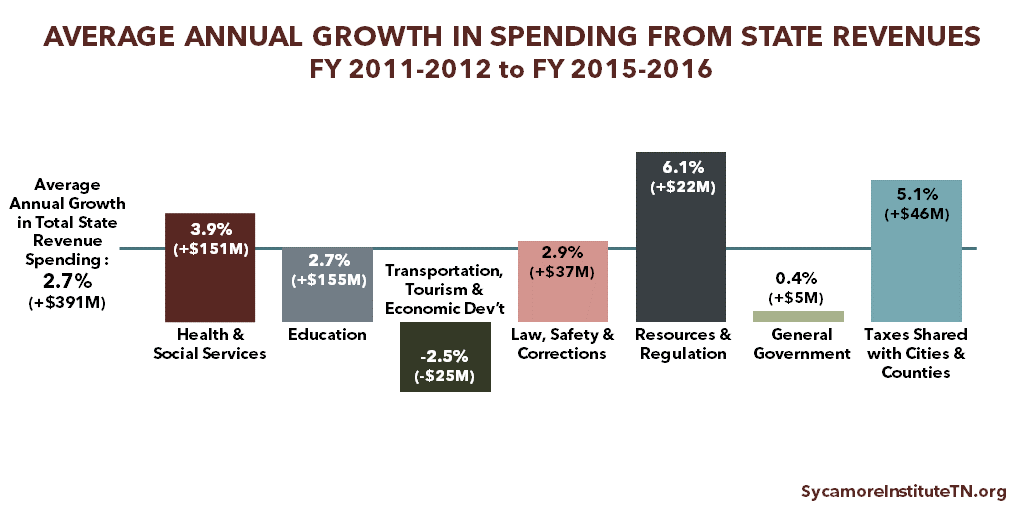
Spending from state revenues grew by an average of 2.7%, or $391 million, each year between FY 2011-2012 and FY 2015-2016. (12) The largest share of new state spending has been for education. The IMPROVE Act, passed in 2017, will increase transportation funding by an estimated $347 million annually once fully phased in, a 37% increase in state revenues over FY 2015-2016 for transportation, tourism, and economic development.
A New Governor’s First Budget
The first weeks of a new governor’s first term are an intense period of state budget decision-making. New governors have until March 1 to send the General Assembly their recommended budget for the next fiscal year. Due to the time required to finalize and print the document, this leaves the new governor about 4 weeks after inauguration to review options and make decisions. In 2003 and 2011, Governors Bredesen and Haslam also chose to hold public budget hearings with each department during this time. These governors were granted 1-2 week extensions of the March 1 deadline by the General Assembly.
During the Transition
Incumbent governors typically offer governors-elect assistance during the transition period between the November election and January inauguration. The Department of Finance and Administration (F&A) may brief governors-elect and their designees on the status of budget development for the coming fiscal year. F&A’s Division of Budget traditionally prepares materials on budget-balancing issues and options, as well as the timeline the new administration will face in its first weeks in office. Traditionally, each department also prepares transition papers for the incoming administration.
The Budget Division usually allows the governor-elect’s finance and policy designees to sit in on budget meetings with outgoing department heads during November and December. These meetings help Budget Division staff prepare their budget analysis and organize additional funding requests for the incoming administration. During the transition, Budget Division staff continue to report to and take direction only from the incumbent administration.
After the Inauguration
Upon taking office, the new governor may ask the new department heads to reevaluate budget priorities. The Budget Division will incorporate any changes into the materials used to review budget options with the new governor and commissioner of F&A.
The Budget Division is led and staffed by career budget analysts and employees, providing continuity between administrations. This office will help the new administration complete all the work necessary to transmit the budget, the appropriations bill, and other budget-related legislation to the General Assembly by the legal deadline. (13)
Related Work by The Sycamore Institute
Tennessee State Budget Primer: A Foundation for Understanding Our State’s Public Policies
updated November 2017
References and Notes
- The Sycamore Institute’s analysis of the FY 2017-2018 Tennessee State Budget (pages A-8 and A-33)
- The FY 2017-2018 Tennessee State Budget (page A-9)
- The Sycamore Institute’s analysis of the FY 2017-2018 Tennessee State Budget (page A-64) and 2016 population estimates from the U.S. Bureau of Economic Analysis (accessed on October 27, 2017 via https://www.bea.gov/iTable/index_regional.cfm)
- The Tax Foundation’s 2017 Facts and Figures (table 4) (https://files.taxfoundation.org/20170710170127/TF-Facts-Figures-2017-7-10-2017.pdfhttps:/taxfoundation.org/facts-figures-2017/)
- The Sycamore Institute’s analysis of the FY 2017-2018 Tennessee State Budget (page A-64)
- The Sycamore Institute’s analysis of the U.S. Census Bureaus’ 2016 Annual Survey of State Government Tax Collections (accessed on October 27, 2017 via https://factfinder.census.gov/bkmk/table/1.0/en/STC/2016/00A2)
- The Sycamore Institute’s analysis of the Tennessee General Assembly Fiscal Review Committee’s annual cumulative fiscal notes for 2011-2016 (obtained from the Fiscal Review Committee) and Fiscal Memo: HB 534-SB1221 (April 20, 2017) (http://www.capitol.tn.gov/Bills/110/Fiscal/FM1477.pdf)
- The Sycamore Institute’s analysis of the National Association of State Budget Officers’ 2014-2016 State Expenditure Report (Table 1) (https://higherlogicdownload.s3.amazonaws.com/NASBO/9d2d2db1-c943-4f1b-b750-0fca152d64c2/UploadedImages/SER%20Archive/State%20Expenditure%20Report%20(Fiscal%202014-2016)%20-%20S.pdf)
- The Sycamore Institute’s analysis of the FY 1996-1997 – FY 2017-2018 Tennessee State Budgets
- USASpending.gov FY 2016 data for Tennessee (accessed on October 4, 2017 via https://www.usaspending.gov/transparency/Pages/statesummary.aspx?StateCode=TN&FiscalYear=2016)
- The FY 2017-2018 Tennessee State Budget (pages A-17 – A-22)
- The Sycamore Institute’s analysis of the FY 2013-2014 – FY 2017-2018 Tennessee State Budgets
- Based on information from Bill Bradley, former director of Tennessee’s Budget Division (obtained on December 18, 2017).