The U.S. Census Bureau released new data last month on health insurance coverage across the U.S. in 2016. Here are our top 3 takeaways for Tennessee.
1. Tennessee’s uninsured rate hit an all-time low in 2016.
- The proportion of Tennesseans who were uninsured fell to 9.0% in 2016 — an all-time low (Figure 1).
- Nationally, the uninsured rate dropped from 9.1% to 8.8%, also an historic low. (1)
Figure 1
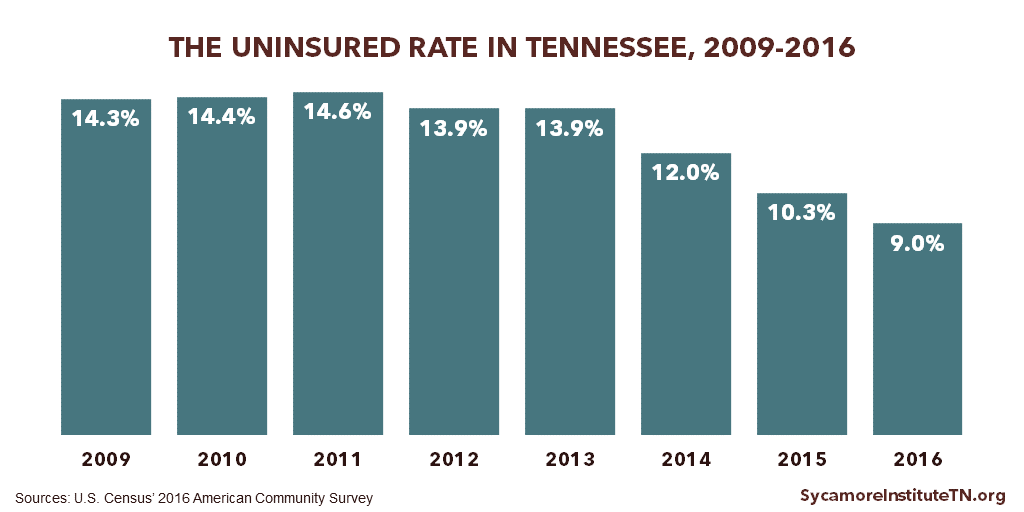
Source: U.S. Census’ 2016 American Community Survey (4)
2. Where Tennesseans get health insurance changed very little from 2015 to 2016.
- The proportion of Tennesseans with employer-sponsored insurance and Medicare did not change from 2015 to 2016 (Figure 2).*
- The proportion covered by TennCare, the state’s Medicaid program, increased from 20.2% in 2015 to 21.6% (Figure 2).*
- The proportion who get their insurance in the individual market, which includes both the Healthcare.gov Marketplaces and other non-group coverage, did not change from 2015 to 2016 (Figure 2).*
Figure 2
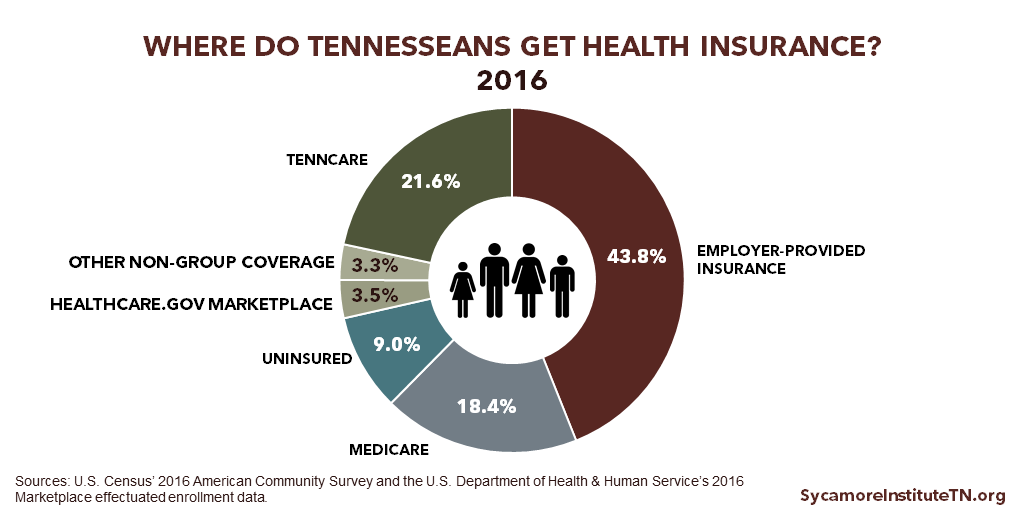
Source: U.S. Census’ 2016 American Community Survey (4)
*The 2015 coverage numbers presented here may differ from numbers we’ve reported in previous work. Our 2016 health insurance coverage estimates are based on American Community Survey (ASC) data while our 2015 coverage estimates were based on Current Population Survey (CPS) data obtained from the Kaiser Family Foundation. ACS data have a larger sample size than CPS data and are recommended by the Census Bureau for subnational estimates. While the rates are slightly different between the two datasets, the trends in coverage rates are the same. Direct comparisons between our previously reported data are not recommended.
3. Coverage rates varied significantly by age, income, education, and race/ethnicity in 2016.
- White Tennesseans had the lowest uninsured rate (8.4%) among racial groups. Hispanic or Latino Tennesseans had the highest uninsured rate (30.5%) (Figure 3).
- Working-age adults (ages 18-64) had higher uninsured rates (13.3%) than children or older adults (Figure 3).
- Uninsured rates fell as incomes and educational attainment increased (Figure 4).
- 14.7% of Tennesseans living in households with incomes below $25,000 were uninsured. 3.8% living in households with incomes above $100,000 were uninsured (Figure 4).
- 20.2% of Tennesseans with less than a high school education were uninsured. 3.7% with a bachelor’s degree or higher were uninsured.(2)
Figure 3
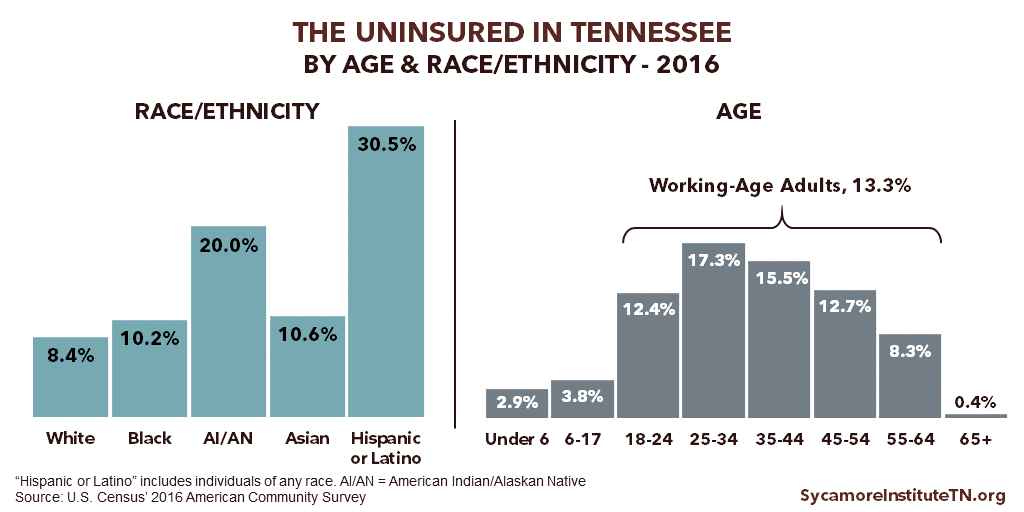
Source: U.S. Census’ 2016 American Community Survey (4)
Figure 4

Source: U.S. Census’ 2016 American Community Survey (4)
The Census Bureau collects data from all U.S. residents who participate in its censuses and surveys, regardless of legal status. You can read the Census Bureau’s full report at Health Insurance Coverage in the United States: 2016.
References
Click to Open/Close
- Galewitz, Phil. Uninsured Rate Falls to Record Low of 8.8%. Kaiser Health News. [Online] September 2017. http://khn.org/news/uninsured-rate-falls-to-a-record-low-of-8-8-percent/.
- Berchick, Edward. Who Are the Uninsured? U.S. Census Bureau: Social, Economic, and Housing Statistics Division. [Online] September 14, 2017. https://www.census.gov/newsroom/blogs/random-samplings/2017/09/who_are_the_uninsure.html.
- Vornovitsky, Marina. Health Insurance Coverage Measurement in Two Surveys. United States Census Bureau, Census Blogs. [Online] September 5, 2017. https://www.census.gov/newsroom/blogs/random-samplings/2017/09/health_insurancecov.html.
- U.S. Census Bureau. American Community Survey. [Online] September 12, 2017. Accessed via https://www.census.gov/library/publications/2017/demo/p60-260.html.