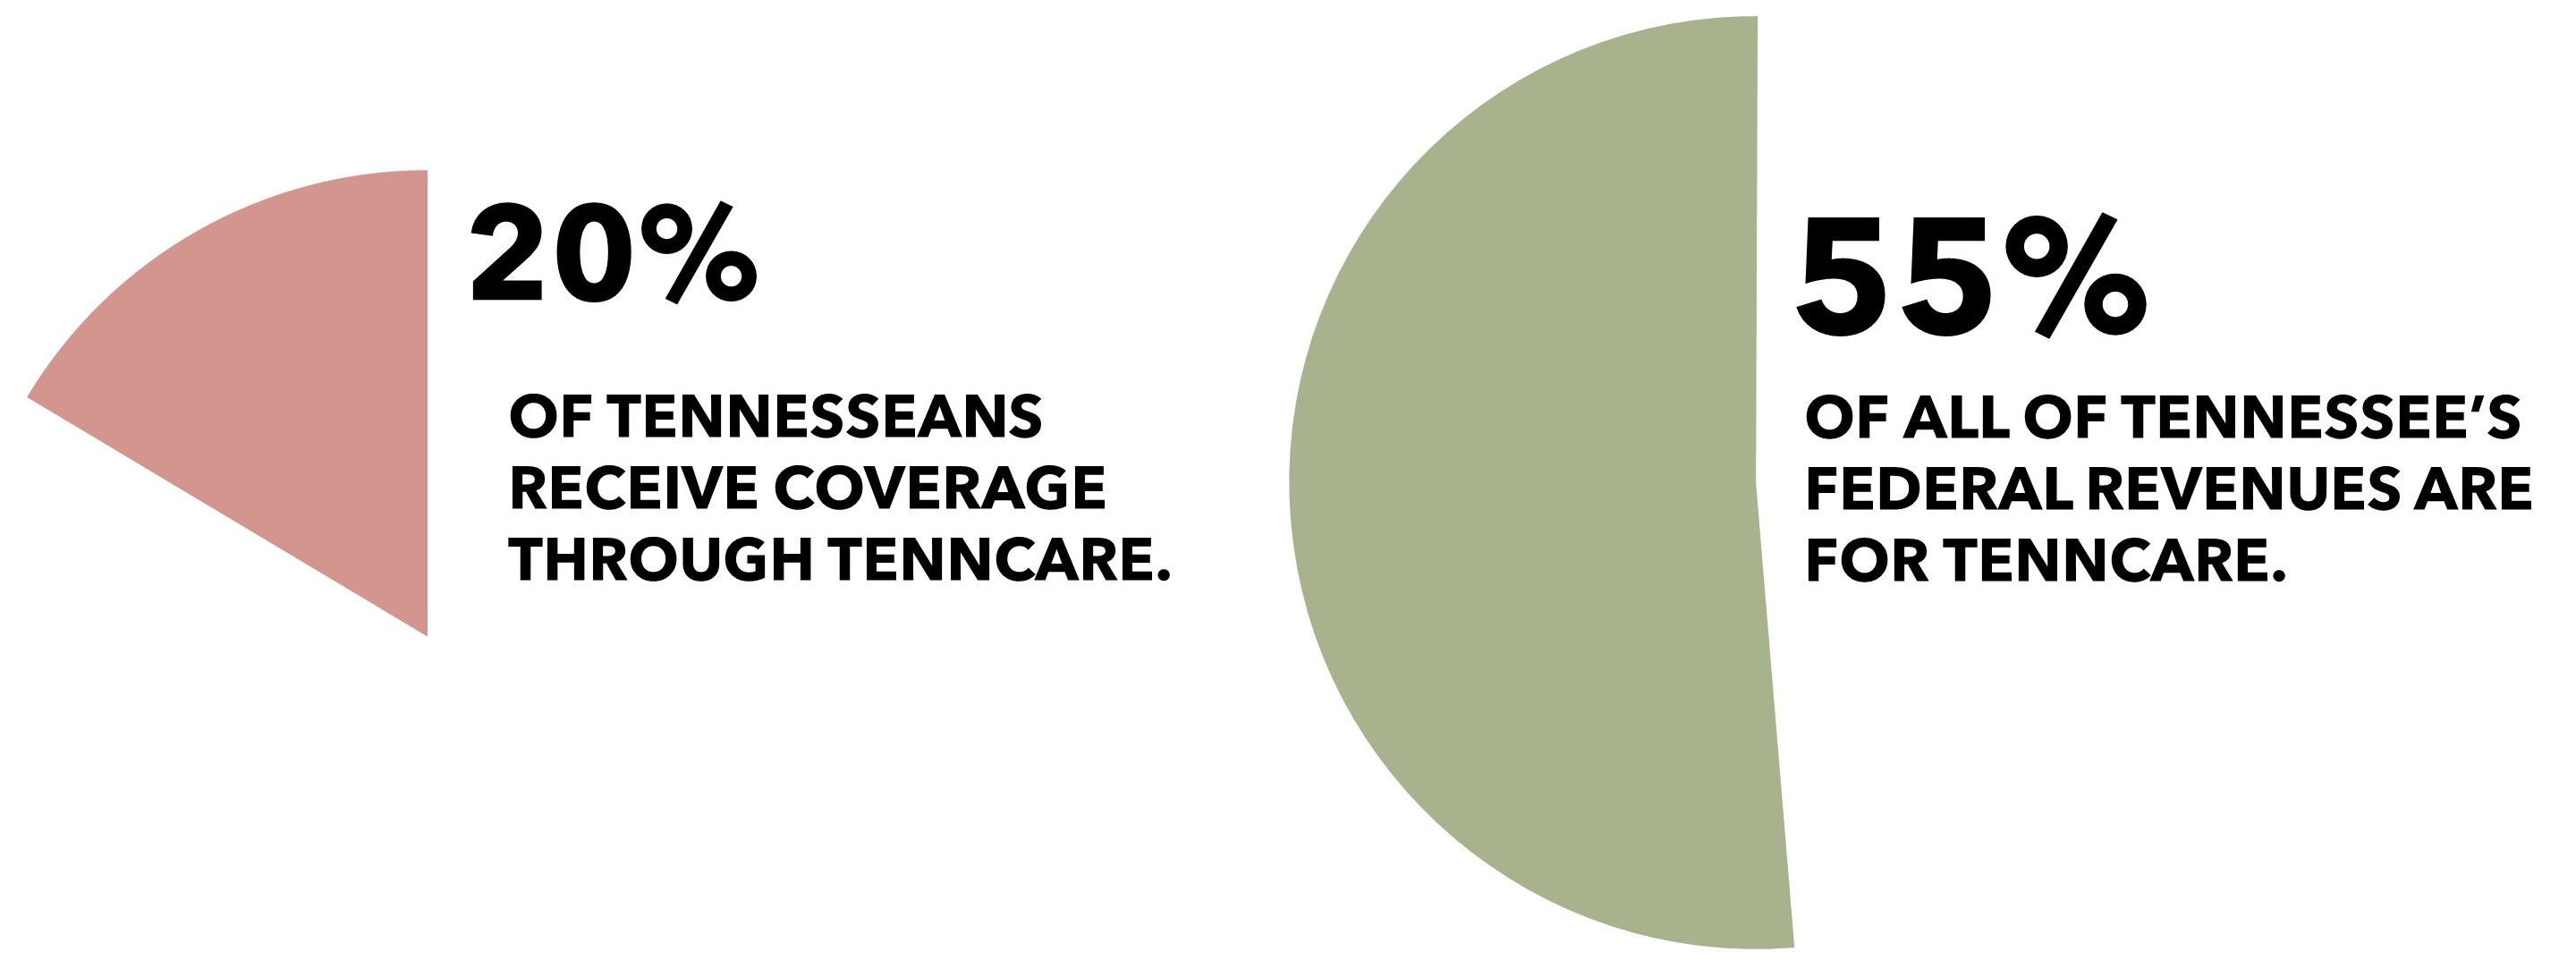
 On March 6th, Speaker Paul Ryan of the U.S. House of Representatives introduced the American Health Care Act, which repeals key provisions of the Affordable Care Act (ACA) and replaces them with reforms to both the individual health insurance market and Medicaid’s financing structure. TennCare, Tennessee’s Medicaid program, provides health insurance coverage to over 20% of all Tennesseans and accounts for 55% of the state’s federal revenues. As shown in our January 2017 series Medicaid Reform 101, any major reforms to Medicaid could significantly alter TennCare. This paper uses 2 approaches to consider how recent proposals might impact federal contributions to TennCare.
UPDATE: Following the Congressional Budget Office’s analysis of the American Health Care Act, we estimate federal contributions to TennCare under that legislation could range from $460 million higher to $2.6 billion lower than current law over the next 10 years. See TennCare’s Federal Funding under the AHCA for more information.
Bottom Line
The American Health Care Act (AHCA) sets annual spending targets for state Medicaid programs based on each state’s federal FY 2016 per enrollee spending, medical inflation, and enrollment. The bill also proposes automatic federal funding reductions for states that fail to meet these targets. We conducted an analysis of the AHCA and learned:
- State FY 2016 was a low-cost year for TennCare spending per enrollee.
- The average annual growth in TennCare spending per enrollee has been slightly less than average medical inflation over the past decade, but the two measures have not tracked closely on a yearly basis.
- Unlike proposals examined in our Medicaid Reform 101 series, Tennessee would not receive a windfall of federal revenue if TennCare per enrollee spending grows slower than the annual targets.
- The AHCA is a reconciliation bill, which is a narrow legislative mechanism that restricts what can be included. Likely for this reason, the bill does not include broad state program design flexibilities for eligibility, benefits, or enrollee requirements. If these provisions cannot be included in the bill, these flexibilities would have to be granted in separate legislation that would require 60 votes to pass the U.S. Senate.
- Tennessee could potentially receive approximately $115 million per year for 4 years from temporary safety net funding provided in the bill for non-expansion states.
The AHCA is likely to undergo significant changes, so we also analyzed how federal savings targets and estimates associated with various U.S. House proposals – including the AHCA and others – may affect federal contributions to TennCare if they were distributed proportionally to all states. In this hypothetical scenario, federal funding for TennCare could be $1 billion to $2 billion lower over the next decade under the AHCA relative to amounts expected under current law and $11 billion to $17 billion lower under the FY 2017 House Budget Resolution.
Although TennCare funding and enrollment data at the level of detail prescribed in the AHCA were not available, our analysis reiterates the conclusion from our Medicaid Reform 101 series: Medicaid reforms are complicated and the details will matter immensely.
Recent Proposals from the U.S. House of Representatives
The Medicaid reforms in The American Health Care Act represent the most complete and detailed such proposal released in recent years.
The bill would create aggregate Medicaid spending targets for each state based on federal FY 2016 spending. These state-specific targets that would vary based on enrollment in 5 enrollee categories. Beginning in federal FY 2020, state spending would be compared to the aggregate spending target for that year. If TennCare spending exceeds the target, federal contributions to TennCare in the following year would be reduced by an amount equal to the prior year’s overage. The first reductions could take place in federal FY 2021.
The legislation would also create a temporary pool of funds for states (like Tennessee) that have not expanded Medicaid eligibility under the ACA. The Appendix summarizes our interpretation of the bill based on the key design elements identified in Part 1 of our Medicaid Reform 101 series. (1) (2)
At the time of our analysis, the Congressional Budget Office (CBO) has not yet released a cost estimate for the legislation. However, one outside analysis of the American Health Care Act estimated that the changes would generate $370 billion in federal Medicaid savings over 10 years – including $116 billion in savings from the financing reform pieces not associated with changes to the ACA’s eligibility expansion. (3)
In addition to the AHCA, the U.S. House has passed several budget resolutions over the last several years that presume changes to Medicaid financing. The most recent budget resolutions include the following 10-year targets for federal Medicaid savings:
- The federal FY 2017 House budget resolution assumed $3 trillion in combined savings over 10 years from both repealing the ACA and reforming Medicaid.(4) One analysis of the budget resolution found Medicaid financing reforms would have accounted for $1 trillion of those savings. (5)
- The federal FY 2016 resolution assumed that Medicaid reforms would reduce the federal government’s Medicaid liability by -$904 billion over 10 years.(6)
- The federal FY 2015 resolution assumed -$732 billion in federal spending reductions over 10 years from Medicaid reforms. (7)
KEY TERMS
FMAP
The federal medical assistance percentage (FMAP) varies based on state and determines the percentage of a state’s Medicaid costs that will be covered by the federal government. Tennessee’s FMAP is about 65%.
WAIVER
A mechanism for states to operate unique or innovative Medicaid programs that waive certain federal rules. TennCare is operated under a waiver.
PER CAPITA CAP
A Medicaid reform concept that would provide a capped payment to state Medicaid programs for each Medicaid enrollee.
CAPPED ALLOTMENT
A Medicaid reform concept that would cap federal Medicaid contributions to states on a lump-sum basis, but actual contributions could be less based on actual spending, enrollment, or other factors.
See our Glossary of Medicaid Terms to better understand these and other key Medicaid concepts and terms.
A Bottom-Up Analysis of Recent House Proposals
One way to analyze these recent U.S. House proposals is to use the design element details to see how they might impact federal contributions to TennCare. We considered the following 3 questions for assessing how the details in the American Health Care Act might impact Tennessee:
- On a year-to-year basis, how has annual growth in TennCare spending per enrollee compared with the bill’s target growth factor?
- Over a 10-year period, how has cumulative growth in TennCare spending per enrollee compared with the cumulative impact of the bill’s target growth?
- Was federal FY 2016 a relatively low-cost year for TennCare or a relatively high-cost year?
- How much could Tennessee receive under the temporary safety net funding for non-expansion states?
The answers to these questions (see What We Learned) provide insights into how TennCare’s annual cost increases compare with the American Health Care Act’s annual growth factors and how the differences stack up over time. They also assess whether the bill’s base year would be an advantageous one for maximizing future federal contributions to TennCare.
Limitations of Our Bottom-Up Analysis
The bottom-up analysis that follows relies on total TennCare expenditures per person. TennCare spending and enrollment data at the level on which Speaker Ryan’s legislation is based (i.e. medical assistance costs by distinct enrollee categories) were not available. This means that the funding metric in our analysis includes:
- Items explicitly excluded from the House bill methodology like delivery system reform costs, uncompensated care pools, cost-sharing for Medicaid-Medicare dual enrollees, children covered under the Children’s Health Insurance Program, partial benefit enrollees, limited Disproportionate Share Hospital (DSH) payments, and administrative costs.
- Items treated differently in the House bill methodology like non-DSH supplemental payments.
The funding data used in this analysis are also only available on a state fiscal year basis, which begins on July 1st of each year. The draft bill’s methodology uses expenditures on a federal fiscal year basis, which begins on October 1st.
The extent to which these limitations impact the outcome of the analyses is unclear. Furthermore, the legislation will likely undergo significant changes that may alter some of the details key to this analysis.
What We Learned From Our Bottom-Up Analysis
Question 1: On a year-to-year basis, how has annual growth in TennCare spending per enrollee compared with the bill’s target growth factor? (Figure 1)
- On a year-to-year basis, annual growth in total TennCare costs per enrollee has not tracked closely with annual inflation for medical care.
- Over the 10-year period, TennCare’s average annual growth in per enrollee expenditures was lower than the medical care component of CPI-U.
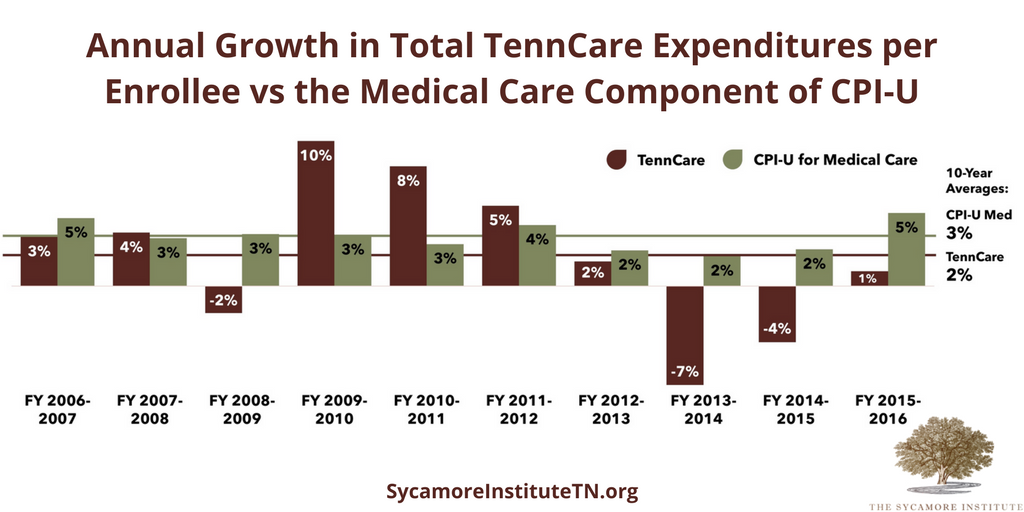
Figure 1 Sources: The Sycamore Institute’s analysis using TennCare funding data from the FY 2008-2009 – FY 2017-2018 Tennessee State Budgets, annual enrollment data from the Bureau of TennCare, and CPI-U data from the U.S. Bureau of Labor Statistics.
Question 2: Over a 10-year period, how has cumulative growth in TennCare spending per enrollee compared with the cumulative impact of the bill’s target growth? (Figure 2)
- Over a 10-year period, the cumulative growth in total TennCare costs per enrollee have been less than the cumulative target growth applied to this period.
- The structure proposed in the House bill would not allow the federal government to pick up more than 65% of state spending on TennCare – even when TennCare’s spending is less than the federal target.
- In 3 of the 10 years, TennCare expenditure growth was higher than the cumulative target growth for those years.
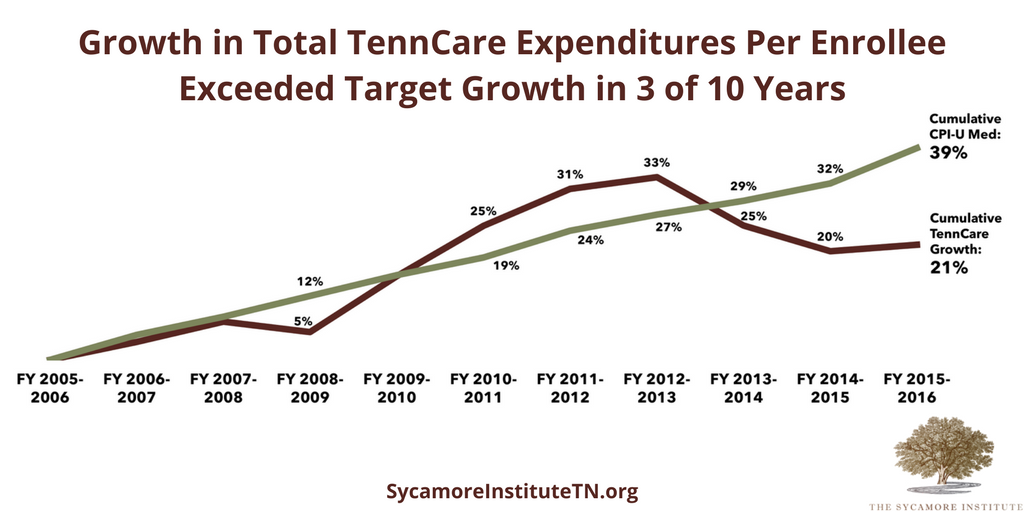
Figure 2 Sources: The Sycamore Institute’s analysis using TennCare funding data from the FY 2008-2009 – FY 2017-2018 Tennessee State Budgets, annual enrollment data from the Bureau of TennCare, and CPI-U data from the U.S. Bureau of Labor Statistics.
Question 3: Was federal FY 2016 a relatively low-cost year for TennCare or a relatively high-cost year? (Figure 3)
- In the context of the most recent 10-year window, state FY 2016 was a relatively low-cost year for TennCare spending per enrollee when adjusted for inflation.
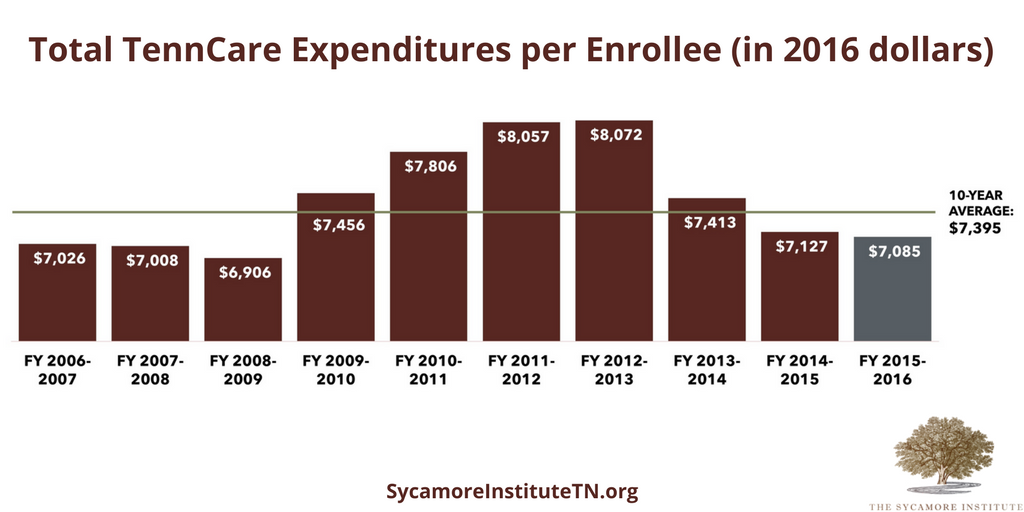
Figure 3 Sources: The Sycamore Institute’s analysis using TennCare funding data from the FY 2008-2009 – FY 2017-2018 Tennessee State Budgets, annual enrollment data from the Bureau of TennCare, and CPI-U data from the U.S. Bureau of Labor Statistics.
Question 4: How much could Tennessee receive under the temporary safety net funding for non-expansion states?
- According to the data source identified in the bill, an estimated 1.4 million children and adult individuals in Tennessee had incomes below 138% of the federal poverty level (FPL) in 2015. This represents about 6% of the relevant population across all 19 states that have not expanded Medicaid.(8)
- The House bill creates a $2 billion/year pool of safety net funds for 4 years. The funds would be distributed based on each non-expansion state’s share of individuals with incomes under 138% of FPL in 2015. The funds could only be used to increase payments made to Medicaid providers.
- 6% of the safety net pool is approximately $115 million per year – or $460 million over 4 years – that Tennessee would potentially be eligible to receive to increase payments made to Medicaid providers during calendar years 2018-2021.
Other Considerations
The introduced version of the American Health Care Act is likely to undergo significant changes through the legislative process. In fact, a number of reports indicated that some Republicans in both the House and Senate have concerns with the approaches included in the introduced legislation. (9) (10)
If Medicaid reform moves as a reconciliation bill, it may be prohibited from including broad provisions related to state program design flexibility. It is possible that the program design flexibilities that many states are expecting to see as part of Medicaid reform were excluded because the bill it is a reconciliation bill. The reconciliation process is a narrow legislative mechanism that comes with restrictions on what can and cannot be changed (see our summary and analysis of the federal reconciliation process). If provisions allowing state’s greater flexibility with program design cannot be included in the bill, these flexibilities would have to be granted in separate legislation that would require 60 votes to pass the U.S. Senate.
A Top-Down Analysis of Recent House Proposals
Another way to look at the recent House proposals – including the AHCA and recent years’ budget resolutions – is to use the overall estimate of federal savings to analyze the potential impact on federal contributions to TennCare. In recent days, these 10-year federal savings estimates have ranged from a high of $1 trillion to a low of $116 billion. (5) (3)
What We Learned From Our Top-Down Analysis
Figure 4 shows backward and forward looking illustrations of how these savings estimates might impact TennCare revenues if they were applied proportionally to all states.

Figure 4 Sources: The Sycamore Institute’s analysis using The Congressional Budget Office’s January 2017 Medicaid baseline estimate and TennCare funding data from the FY 2008-2009 – FY 2017-2018 Tennessee State Budgets. (11)
Limitations of Our Top-Down Analysis
This top-down analysis is intended for illustrative purposes only due to its simplistic approach to estimating the impact on federal contributions to TennCare. The approach includes a number of assumptions and limitations:
ASSUMPTIONS
The federal savings estimates used in the analysis would apply only to the reforms to the financing structure. Any changes to the Medicaid expansion would be a separate savings estimate. If either savings estimate includes any savings associated with the Medicaid expansion, the savings would disproportionately impact expansion states and the impact on Tennessee would be smaller.
The federal savings would affect all states’ federal funding uniformly.
The final details of federal reforms could shift these estimates up or down.
LIMITATIONS
Other details that would affect the actual impact include the basic structure (e.g. block grant, per capita cap) and how the base is determined, including whether this determination tries to account for differences between states or is based only on some current level of spending.
HOW MIGHT REFORMS ADDRESS STATE DIFFERENCES?
One example is the 2013 House Energy & Commerce proposal. That proposal would attempt to smooth out “differences” between state Medicaid spending by allowing smaller reductions for low-cost states and bigger reductions for high-cost states. (14) Under a proposal like this, Tennessee would see fewer federal reductions to the extent that it is a “low-cost” state and greater reductions to the extent it is a “high-cost” state. According to 2011 data, Tennessee’s per capita costs were low compared to other states for aged and disabled enrollees, high for adults, and average for children. (13)
CBO’s estimates of the impact of various options to cap Medicaid spending show that annual federal spending reductions grow each year – producing very little savings in the first few years and very large savings in the latter part of the estimate window. This means that reductions to federal funding would not have a uniform annual impact but would instead grow each year relative to estimated federal spending under current law. Furthermore, these reductions would likely continue to grow larger outside the 10-year window. (12)
In regard to the “look-back,” the actual federal TennCare revenues reflect the decisions that were made by state policymakers within the context of current law. In the face of a different federal financing structure and additional administrative flexibilities, these decisions would likely have been different.
In regard to the “projection,” making projections is difficult. Medicaid costs are volatile. For example, CBO projects annual federal Medicaid costs to grow by 5-6% each year over the next 10 years. While average annual growth in total TennCare costs over the last 10 years has been 5%, the actual annual growth during that period ranged from 0% to 10%. Furthermore, these reductions do not take into account any changes in FMAP that might occur under current law.
Parting Words
The stakes for Medicaid reform are high. Federal contributions to TennCare represent over half of all the federal dollars flowing to the state budget. Reductions to these dollars may provide incentives to find ways to operate TennCare more efficiently. Federal reductions may also put pressure on state lawmakers to constrain enrollment, reduce benefits, or find more state funding for the program through higher taxes or reduced spending in other areas. Understanding how the details of federal reform proposals impact these incentives and pressures will clarify how state policymakers will need to plan and respond in the coming years.
Appendix: Summary of the American Health Care Act
Federal Financing
Basic Structure
Blends a per capita cap and a capped allotment concept. Makes each state’s federal Medicaid dollars subject to annual lump-sum reductions for exceeding aggregate spending targets based on state-specific per capita targets and actual enrollment.
For any given year, a state’s federal funding could be subject to an automatic reduction if it spent more than its target in the prior fiscal year. The amount of that automatic reduction would be equal to the federal government’s share of the amount by which the state exceeded its target. The first reductions would begin in FFY 2021.
Spending Categories
Applies to all medical assistance costs. The per enrollee medical assistance amounts would also be adjusted to include support for non-DSH supplemental payments based on the ratio of those payments to medical assistance spending in FFY 2016. Non-DSH supplemental payments refer to payments made to providers that are neither direct payment for medical care nor Disproportionate Share Hospital (DSH) payments. These supplemental payments are often for things like the costs of training resident physicians. Specifically excluded from the calculation would be certain special payments made under Medicaid waivers for delivery system reform, uncompensated care pools, designated state health programs, or other similar expenditures to be defined by the Secretary of HHS.
According to the Social Security Act, medical assistance includes all traditional health care services, nursing facility services, pharmaceutical costs, mental health services, home and community-based care, and long-term services and supports.
DSH payments are based on state-specific allotments laid out in law. They support supplemental payments to hospitals that serve a large share of Medicaid and uninsured patients. DSH payments and cost-sharing payments for enrollees eligible for both Medicare and Medicaid are explicitly excluded from the methodology. Federal funding for excluded spending would presumably remain unchanged from current law.
Eligibility Criteria
Each state’s spending target would be based on 5 broad Medicaid eligibility categories: aged, blind and disabled, children, adults receiving coverage under the ACA’s Medicaid expansion, and other nonelderly, nondisabled, nonexpansion adults.
Explicitly excluded eligibility categories include children covered by the Children’s Health Insurance Program (CHIP), individuals covered by the Indian Health Service, partial benefit enrollees, and women receiving limited benefits through the Breast and Cervical Cancer Program. Federal funding for excluded categories would presumably remain unchanged from current law.
Base Year
Spending targets would be based on average spending per enrollee in federal FY 2016, which ended on 9/20/2016.
Cap Growth
The spending target would grow each year by the medical care component of the consumer price index.
State Differences
The bill does not include an approach to state differences.
State Contribution
The legislation preserves the current state contribution requirements as defined by the FMAP. At a minimum, states would have to contribute at least their share under the FMAP. For Tennessee, the state share is approximately 35%. If a state were subject to a penalty, it would have to cover both its FMAP share and the costs associated with the federal reduction.
ACA Expansion
As of 12/31/2019, the bill would repeal the state option to expand Medicaid eligibility and would end the enhanced FMAP for any existing expansion enrollees continuously enrolled before that time.
The bill includes language which appears to provide an opportunity for states that had not expanded eligibility by FFY 2016 to do so prior to 12/31/2019 and receive the traditional FMAP for any spending on these individuals in the same way as described above for existing expansion enrollees. The bill also includes 4 years of safety net funding for non-expansion states (see below).
The bill includes a total of $8 billion for safety net grants to non-expansion states to be distributed over 4 years (CYs 2018-2021). The funds would be used to increase payments to Medicaid providers. The funds would be distributed based on each non-expansion states’ share of individuals below 138% of FPL in 2015 among all non-expansion states.
State Benefit Design
State Flexibility
The bill does not include broad new program design flexibilities related to Medicaid eligibility and benefits requirements. Includes targeted flexibilities that repeal essential health benefits requirements for certain Medicaid coverage, changes to requirements for retroactive benefits, and attestation of citizenship by applicants.
Federal Accountability
The bill would require federal auditing of the data that would be used to calculate each state’s target. The federal government would, for a short period, pick up all or a greater share of any state costs associated with complying with these audits and any new data reporting requirements. Any state that fail to submit the necessary data spending and enrollment data necessary to calculate the target would have its growth factor for that year’s target reduced by 1 percentage point.
References
Click to Open/Close
- Ryan, Paul. The American Health Care Act. U.S. House of Representatives. March 6, 2017. https://housegop.leadpages.co/healthcare/.
- Social Security Act. Section 1905(a). https://www.ssa.gov/OP_Home/ssact/title19/1905.htm
- Park, Edwin. House GOP Medicaid Provisions Would Shift $370 Billion in Costs to States Over Decade. Center on Budget and Policy Priorities. March 7, 2017. http://www.cbpp.org/blog/house-gop-medicaid-provisions-would-shift-370-billion-in-costs-to-states-over-decade.
- U.S. House of Representatives Budget Committee. H.Rept. 114-470. 114th Congress. March 23, 2016. http://budget.house.gov/uploadedfiles/fy2017_budget_resolution.pdf.
- Carroll, Aaron. How Would Republican Plans for Medicaid Block Grants Actually Work? The New York Times. February 6, 2017. https://www.nytimes.com/2017/02/06/upshot/how-would-republican-plans-for-medicaid-block-grants-actually-work.html.
- U.S. House of Representatives Budget Committee. H.Rept. 114-47. 114th Congress. March 20, 2015. https://www.congress.gov/congressional-report/114th-congress/house-report/47.
- —. H.Rept. 113-403. 113th Congress. April 4, 2014. https://www.congress.gov/congressional-report/113th-congress/house-report/403.
- U.S. Census Bureau. 2015 1-Year Estimates. American Community Survey. 2016. https://www.census.gov/programs-surveys/acs/technical-documentation/table-and-geography-changes/2015/1-year.html
- Fox, Maggie. Obamacare Lite? New GOP Health Care Bill Has Host of Critics. NBC News. March 7, 2017. http://www.nbcnews.com/health/health-care/obamacare-lite-new-gop-health-care-bill-has-host-critics-n729931.
- Weigel, David. ‘Obamacare Lite,’ ‘RINOcare’: Conservatives rebel against GOP’s ACA bill. The Washington Post. March 7, 2017. https://www.washingtonpost.com/news/powerpost/wp/2017/03/07/obamacare-lite-rinocare-conservatives-rebel-against-gops-aca-bill/.
- Congressional Budget Office. Detail of Spending and Enrollment for Medicaid for CBO’s January 2017 Baseline. January 2017. https://www.cbo.gov/sites/default/files/recurringdata/51301-2017-01-medicaid.pdf.
- —. Impose Caps on Federal Spending for Medicaid. Options for Reducing the Deficit: 2014 to 2023. November 2013. https://www.cbo.gov/budget-options/2013/44889.
- Kaiser Family Foundation. Medicaid Spending per Enrollee FY 2011 (Full or Partial Benefit). http://kff.org/medicaid/state-indicator/medicaid-spending-per-enrollee/?currentTimeframe=0&sortModel=%7B%22colId%22:%22Children%22,%22sort%22:%22asc%22%7D.
- Upton, Fred and Hatch, Orrin. Making Medicaid Work: Protect the Vulnerable, Offer Individualized Care, and Reduce Costs. U.S. House of Representatives Energy & Commerce Committee. May 1, 2013. https://energycommerce.house.gov/sites/republicans.energycommerce.house.gov/files/analysis/20130501Medicaid.pdf.