Governor Bill Haslam released his 2017 Tennessee Budget recommendation for consideration by the General Assembly on January 30. The governor’s $37 billion FY 2017-2018 Budget proposes a variety of changes to how Tennessee’s state government raises revenue and spends money. Read on for a detailed summary and analysis, and download our 1-page infographic for a quick snapshot.
The Budget recommendation effectively shifts part of the General Fund’s robust revenue growth to the Highway Fund by cutting taxes for the General Fund and increasing those for the Highway Fund. The Budget also uses projected revenue growth and spending reductions to fund continued cost increases for state employees, TennCare, and K-12 Education along with new investments for capital improvements.
FY 2016-2017 Changes
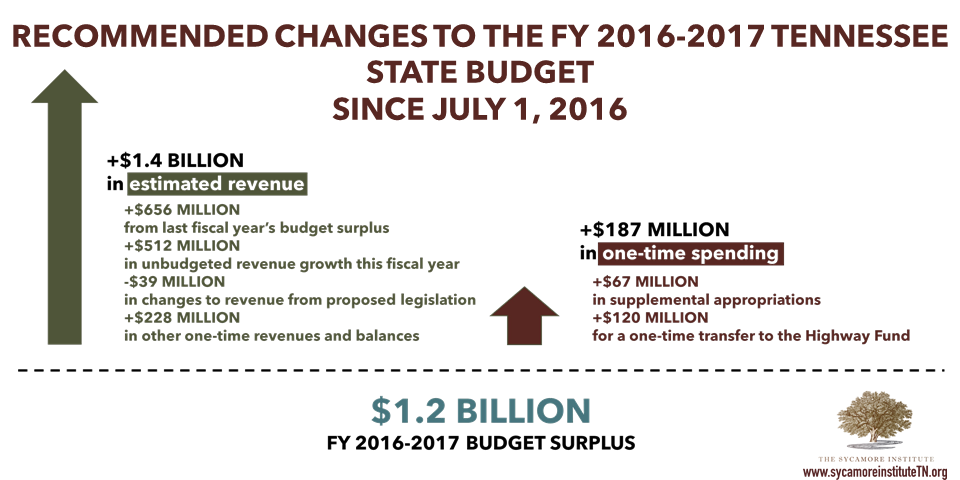
Figure 1 Source: “Available Funds Fiscal Year 2016-2017” (pA23) from the FY 2017-2018 Tennessee State Budget.
Each year, the Budget not only includes a recommendation for the upcoming fiscal year. It also includes changes to the current fiscal year that reflect new estimates for tax collections and additional spending requests for any emerging needs. Understanding these changes for the current fiscal year (FY 2016-2017) provides context for the recommendations for FY 2017-2018.
KEY FACTS:
- The Budget reflects $1.4 billion in new revenue that was not accounted for and budgeted when the current fiscal year began on July 1, 2016. These updated revenue estimates include surplus from last year, better-than-budgeted revenue growth this year, a handful of proposed legislative changes to revenues this year, and other one-time revenues and balances.
- The Budget recommends putting a portion of the unexpected revenues to use through one-time (i.e. non-recurring) supplemental appropriations and a one-time +$120 million transfer to the Highway Fund.
- Of the +$67 million supplemental appropriation recommendation, a few key recommendations include:
- +$25 million for Fast Track Infrastructure and Job Training Assistance within the Department of Economic and Community Development
- +$15 million to fulfill a state match requirement for the Foothills Parkway
- +$10 million for wildfire suppression costs
- Together, these revisions to FY 2016-2017 leave a $1.2 billion FY 2016-2017 surplus that becomes available as a source of non-recurring expenditures for FY 2017-2018.
FY 2017-2018 Recommendation
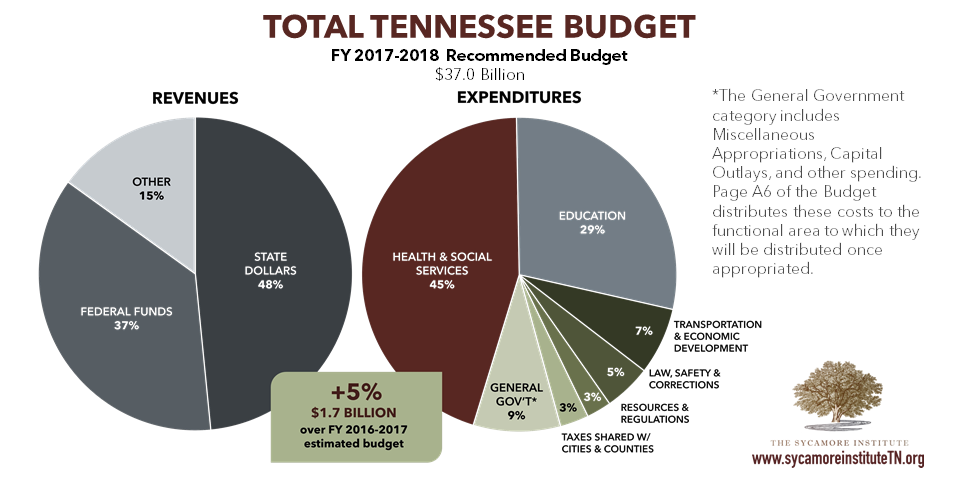
Figure 2 Sources: The Sycamore Institute’s analysis of “Total State Budget: Comparison of Programs and Revenue Sources” (pA8) and “Comparison of Programs” (ppA17-A22) from the FY 2017-2018 Tennessee State Budget.
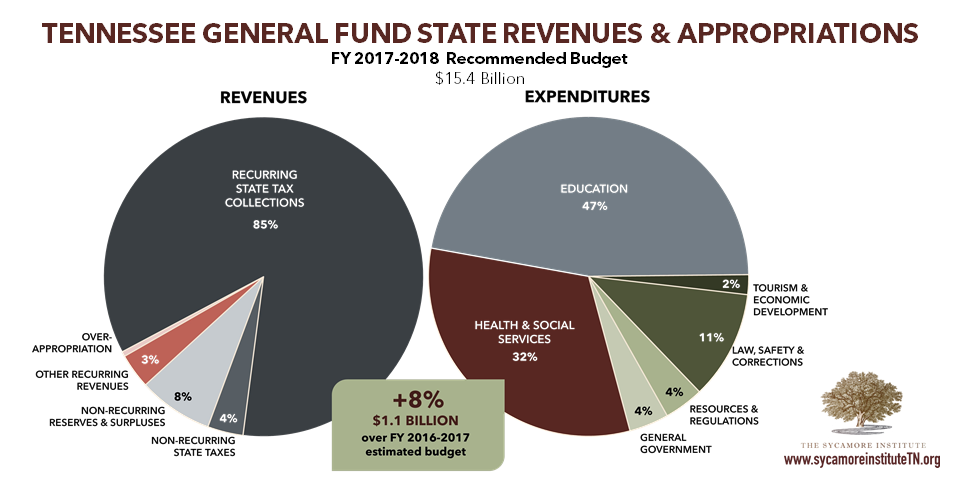
Figure 3 Source: The Sycamore Institute’s analysis of “The General Fund Budget” (pA7) and “General Fund and Education Fund Comparison of Appropriation Requirements and State Revenues” (pA11) from the FY 2017-2018 Tennessee State Budget.
Figure 2 above shows where the state’s revenues are coming from and where they are going for the total state budget. This provides context for the rest of the discussion and analysis, which focus on the state dollars piece of the total state budget pie. Figure 3 shows the revenue sources and expenditures only for the General Fund state revenues. The General Fund state appropriations represent 86% of total state appropriations spending and include everything except transportation costs, tax collections distributed to cities and counties, and debt service costs.
Our Analytic Approach: It is important to remember that the starting point for a fiscal year’s budget is the prior fiscal year’s recurring base budget. Any non-recurring items essentially reset to zero, since these expenditures and revenues are considered one-time. For this reason, the Budget’s own analysis often focuses on how the recommendation is different than the base budget. Many Tennesseans, however, may be more interested in comparisons between the recommendation’s bottom line to the prior year’s bottom line that includes both recurring and non-recurring items.
In our analysis below, we explain how the Budget recommendation balances while providing both points of comparison for non-recurring items. We discuss totals for non-recurring items along with analysis of how those non-recurring totals compare with the FY 2016-2017 non-recurring totals. The first approach shows how the recommendation compares to the base budget while the second shows how the recommendation compares to the bottom line budget that includes both recurring and non-recurring items.
NOTE: The figures presented here balance when considering overappropriations, end-of year balances, and a few small adjustments not itemized here. See pA11 of the Budget Document and p1 of the Budget Overview for a detailed accounting from 2 different perspectives of how the recommended Budget balances.
What Are the Budget’s Recommended Investments and Cost Increases?
General Fund: The Budget includes a number of investments and cost increases in the General Fund. Among these are +$881 million in recurring cost increases and a total of $1.6 billion in non-recurring spending, which is +$365 million more than total non-recurring spending in FY 2016-2017.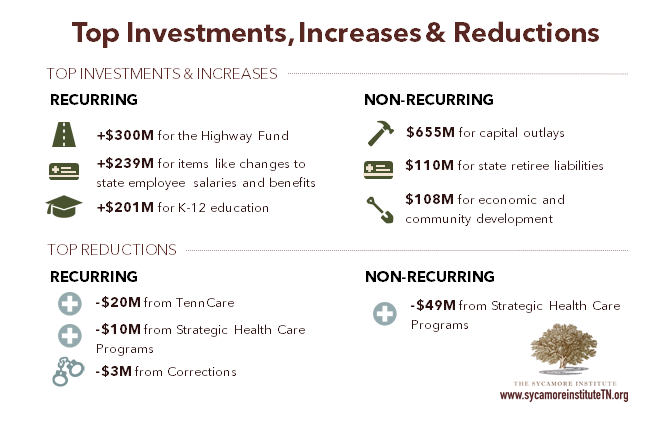
Top Recurring Increases
- +$239 million for Miscellaneous Appropriations for things like state employee salary increases, retirement contributions, and health insurance rate increases (see ppB20-B24 of the Budget).
- +$201 million for K-12 Education for increased teacher pay and benefits costs, Basic Education Program (BEP) formula growth, and additional English language learners teachers (see ppB82-B85 of the Budget).
- +$201 million for TennCare for expected increases in pharmaceutical spending and health care costs (see ppB140-B143 of the Budget)
- +$132 million for Higher Education primarily for capital maintenance, increased operating costs, and salary increases (see ppB86-B90 of the Budget).
Top Non-Recurring Expenditures
- $655 million for the Capital Outlay program, including the Facilities Revolving Fund, which is +$185 million more than in FY 2016-2017.
- $110 million for the state’s Other Post-Employment Benefits (OPEB) liability (see ppB21 of the Budget). This is a new non-recurring investment for this purpose.
- $108 million for the Department of Economic and Community Development to help the state broadly and rural areas specifically recruit new business and expand broadband access (see ppB314-B316 of the Budget). This amount is -$2 million less than the non-recurring amounts budgeted for ECD in FY 2016-2017.
- $48 million for K-12 Education to increase funding for current year enrollment growth, upgrade technical education equipment, and support a charter school facilities fund (see ppB82-B85 of the Budget). This amount is +$34 million more than the non-recurring amounts budgeted for K-12 education in FY 2016-2017.
The Budget also includes a $132 million non-recurring deposit to the Rainy Day Fund, which is +$32 million more than planned for deposit this year.
Highway Fund: In addition to these increases, the Budget includes a +$300 million state revenue increase to the Highway Fund.
How Are These Investments and Costs Funded in the Budget?
Tennessee’s budget must be balanced, which means that any new spending increases must be funded either from new revenues or from cuts to existing programs.
Increases to Budgeted Revenues
General Fund: The FY 2017-2018 recommendation budgets an additional +$1.1 billion in General Fund revenues over the re-estimated FY 2016-2017 Budget. These budgeted revenues are a mix of both recurring and non-recurring revenues. This distinction between recurring and non-recurring is important because it limits the kinds of expenses that the revenues can be spent on in FY 2017-2018.
+$758 million of the budgeted increase is made up of changes to recurring revenues. These funds are available for recurring cost increases or recurring revenue cuts. This increase is primarily comprised of the +$512 million better-than-budgeted revenue growth estimated for FY 2016-2017 and an additional +$367 million in revenue growth for FY 2017-2018. We would note that the $512 million revenue growth occurred from recurring sources of state revenue, but the Budget classifies it as non-recurring in FY 2016-2017 because the FY 2016-2017 unbudgeted collections become a non-recurring source of revenue in FY 2017-2018 (see below). These revenue increases are partially offset by the Governor’s legislative proposals that, together, reduce recurring General Fund taxes by -$208 million.
+$317 million of the budgeted increase comes from changes to budgeted non-recurring revenues, which total $1.6 billion in FY 2017-2018. To make balancing the budget easier in the long-term, non-recurring sources of revenue are generally only used for non-recurring costs. The largest source of these non-recurring revenues: $1.2 billion from the expected FY 2016-2017 budget surplus.
 Highway Fund: The Budget includes a total of +$300 million in increased state revenues for the Highway Fund – $279 million of which are obtained from increased state taxes and revenues proposed as part of the Governor’s IMPROVE Act.
Budget Reductions
General Fund: Changes in the revenues available for spending are not the only sources available for new spending or new tax cuts. In addition to the overall General Fund increase, the Budget also makes room for new investments by recommending ‑$43 million in recurring base reductions and -$49 million in non-recurring reductions.
Top 3 Recurring Reductions
- -$20 million from TennCare related primarily to delivery system reform savings and Intellectual and Development Disabilities waiver utilization (see p25 of Volume 2 of the Budget).
- -$10 million from Strategic Health Care Programs primarily from the use of reserves and lower expected enrollment in the CoverKids program (see p43 of Volume 2 of the Budget).
- -$3 million from Corrections related to the food services budget (see p31 of Volume 2 of the Budget).
Non-Recurring Reduction
- -$49 million from Strategic Health Care Programs associated with an increase in the federal match rate (see p43 of Volume 2 of the Budget).
Other Adjustments
In addition to these recommendations, the Budget also includes -$83 million in recurring preliminary base budget reductions. These preliminary adjustments are often outside the control of the state’s policymakers. For example, the state was informed by the federal government that the state’s match rate for TennCare in FY 2017-2018 is lower than for FY 2016-2017. Under the new match rate, Tennessee’s appropriations requirements would be about -$49 million less than under the current match rate. These dollars become available for other recurring expenses.
The Highway Fund
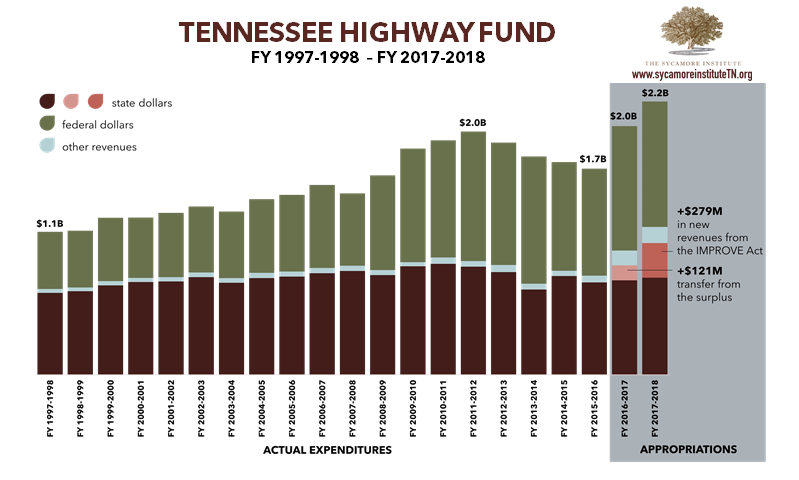
Figure 4 Sources: The Sycamore Institute’s analysis of “Total State Budget: Comparison of Programs and Revenue Sources” from the FYs 1996-1997 through 2017-2018 Budgets, Recovery Act funding information in the FYs 2012-2013 through 2015-2016 Budgets, and the 2009 Tennessee Comprehensive Annual Financial Report.
Note: Funds appropriated in one year may be spent and reported as actual expenditures in a future year. For this reason the FY 2016-2017 and FY 2017-2018 appropriations estimates are not considered comparable to the FY 1997-1998 – FY 2015-2016 amounts. Includes a total of $596M in one-time federal funding provided by the Recovery Act that was spent on transportation between FY 2008-2009 and FY 2013-2014.
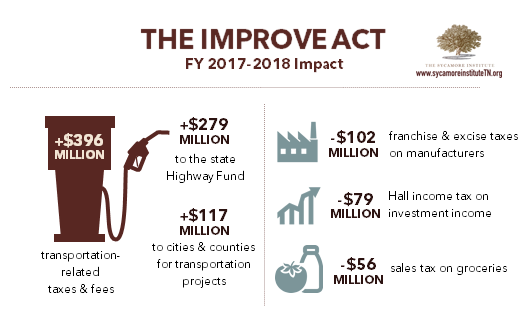
One of the key pieces of the Budget is the inclusion of the Governor’s Improving Manufacturing, Public Roads and Opportunities for a Vibrant Economy (IMPROVE) Act, which aims to increase funding for transportation projects.
KEY FACTS:
- As part of its recommended changes to the current year, the Budget includes a one-time $121 million transfer from the General Fund to the Highway Fund in FY 2016-2017. These funds are available because of greater-than-expected General Fund revenue collections.
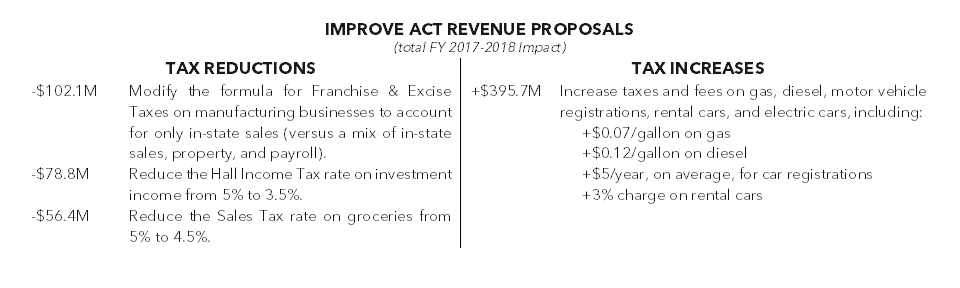
- The IMPROVE Act proposes boosting transportation funding in FY 2017-2018 and beyond by increasing the revenue sources for the Highway Fund. These revenue sources include taxes and fees on gas, diesel, motor vehicle registrations, electric cars, and rental vehicles.
- The IMPROVE Act would result in revenue increases to the Highway Fund that total an estimated +$279 million in FY 2017-2018.
- Additionally, these increased revenues would increase the amounts shared with cities and counties for transportation projects by an estimated +$117 million.
- The proposal includes indexing some of these taxes to inflation, which means that these amounts would grow over time.
- In FY 2014-2015, federal dollars made up 51% of Tennessee’s Highway Fund – the 7th highest proportion in the country.[1]
- The appropriations estimates for FY 2016-2017 and FY 2017-2018 are not considered comparable to other years because funds appropriated in one year may be spent and reported as actual expenditures in a future year.
See our Tennessee Highway Fund Fact Sheet for additional information and context.
State Tax Sources
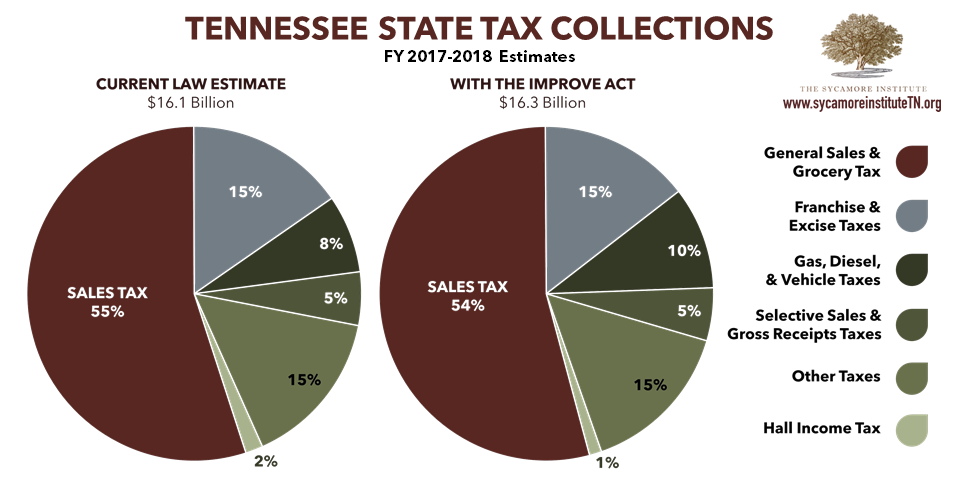
Figure 5 Source: The Sycamore Institute’s analysis of “Comparison Statement of State Revenues” (pA64) from the FY 2017-2018 Tennessee State Budget and slide 2 from the FY 2018 Recommended Budget presentation by the TN Department of Finance and Administration.
Figure 5 displays the distribution of Tennessee’s FY 2017-2018 state tax collections both with and without the IMPROVE Act. It includes all taxes collected by the state – including those shared with cities and counties.
KEY FACTS:
- The IMPROVE Act pairs Highway Fund revenue increases with reductions to revenue sources for the General Fund – which funds nearly all the non-transportation activities of the state. The impacted revenue sources include the sales tax on groceries, the franchise and excise taxes on manufacturers, and the Hall Income Tax on investment income. Most of these Highway and General Fund taxes are also shared with cities and counties.
Source: Slide 2 from the FY 2018 Recommended Budget presentation by the TN Department of Finance and Administration.
- The Budget also includes estimates of the tax collections under current law without the changes proposed in the IMPROVE Act (see pA63 of the Budget).
- The Budget’s recommended levels of spending, however, reflect the revenue changes proposed in the IMPROVE Act. Compared to revenue projections under current law, the Budget’s spending levels reflect fewer revenues available for General Fund expenses and greater revenues for Highway Fund expenses.
State Tax Growth
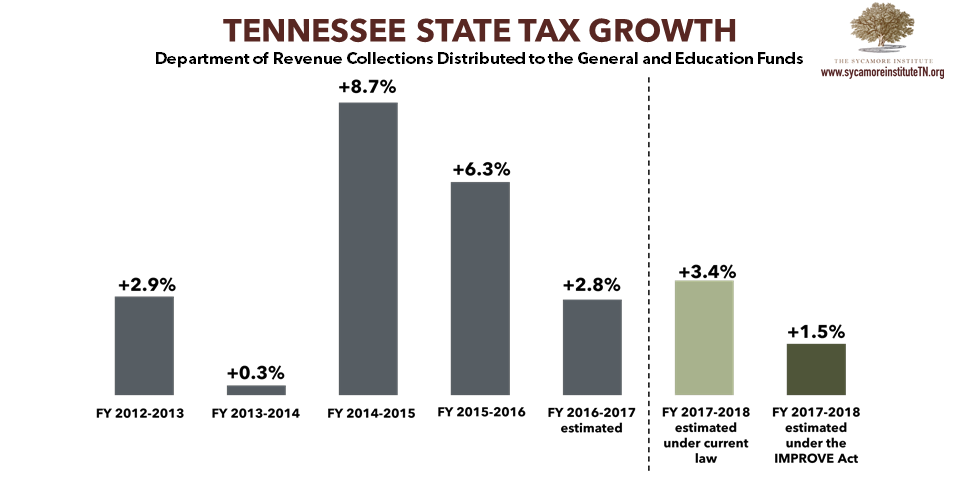
Figure 6 Source: The Sycamore Institute’s analysis of “Distribution of Actual Revenue by Fund” (pA65) from the FYs 2014-2015 through 2017-2018 State Budgets, “Distribution of Revised Estimated Revenue by Fund” (pA66) and “Distribution of Estimated Revenue by Fund” (pA67) of the FY 2017-20018 Budget, and slide 2 from the FY 2018 Recommended Budget presentation by the TN Department of Finance and Administration.
Figure 6 shows the Budget’s estimates of how state tax collections for the General Fund are expected to grow both with and without the IMPROVE Act in FY 2017-2018. Recent years’ annual growth in these collections also appear alongside these estimates.
KEY FACTS:
- State taxes dedicated to the General Fund pay for nearly all of the non-transportation services and activities supported by Tennessee.
- The recent budget surpluses have been the result of unexpectedly large annual growth in these collections.
- As shown above, the Budget estimates that Department of Revenue collections distributed to the General and Education Funds will increase by +3.4% or +$393 million in FY 2017-2018. The recurring portion of these tax collections are expected to grow by +3.17% or +$367 million.
- The Budget proposes forgoing some of this expected growth by reducing General Fund taxes as proposed in the IMPROVE Act.
Page 10 “How Are We Doing? Revenue Estimation” discusses the implications of revenue estimation under a balanced budget, just how hard it is to do well, and how estimates have stacked up against actuals in recent years.
State Tax Cuts
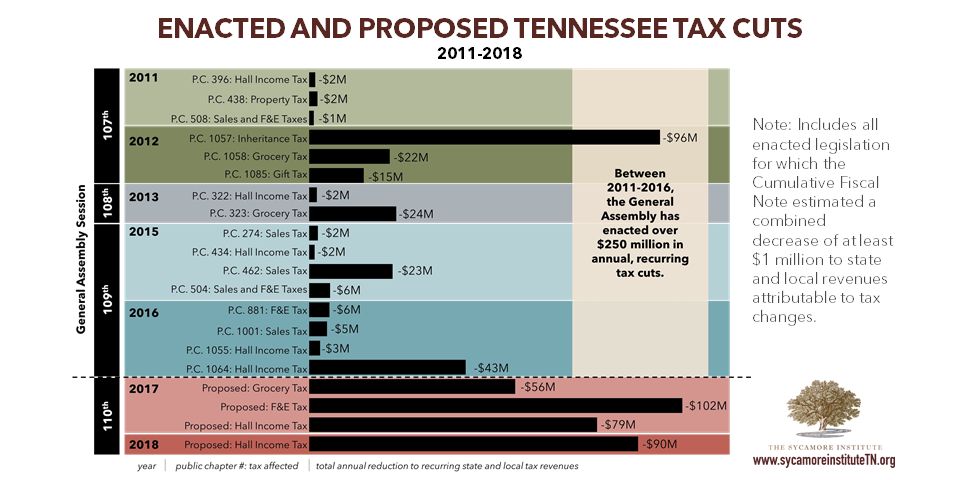
Figure 7 Sources: The Sycamore Institute’s analysis of the 2011-2016 Cumulative Fiscal Notes from the TN General Assembly’s Fiscal Review Committee and the FY 2018 Recommended Budget presentation by the TN Department of Finance and Administration.
Over the last several years, state policymakers have prioritized cutting the tax load for Tennesseans and businesses operating in Tennessee. The figure above shows all of the tax cuts enacted in the last 3 sessions of the General Assembly alongside the tax cut proposals in the current Budget. The numbers displayed represent the estimated combined annual, recurring impact on state and local revenues.
KEY FACTS:
- Between 2011-2016, the General Assembly and Governor have enacted over $250 million in annual, recurring tax cuts, including:
- -$111 million from repealing the Inheritance and Gift Taxes
- -$51 million in cuts to the Hall Income Tax
- -$46 million in cuts to the Sales Tax on Groceries
- As part of the IMPROVE Act package, the FY 2017-2018 Budget proposes the following additional cuts:
- -$169 million from accelerating the phase-out of the Hall Income Tax over the next 2 years
- -$102 million from restructuring the Franchise & Excise (F&E) Taxes on manufacturers
- -$56 million from reducing the Grocery Tax from 5% to 4.5%
- If enacted, total tax cuts between 2011 and 2018 would total $580 million in annual, recurring reductions.
Base Budget Reductions
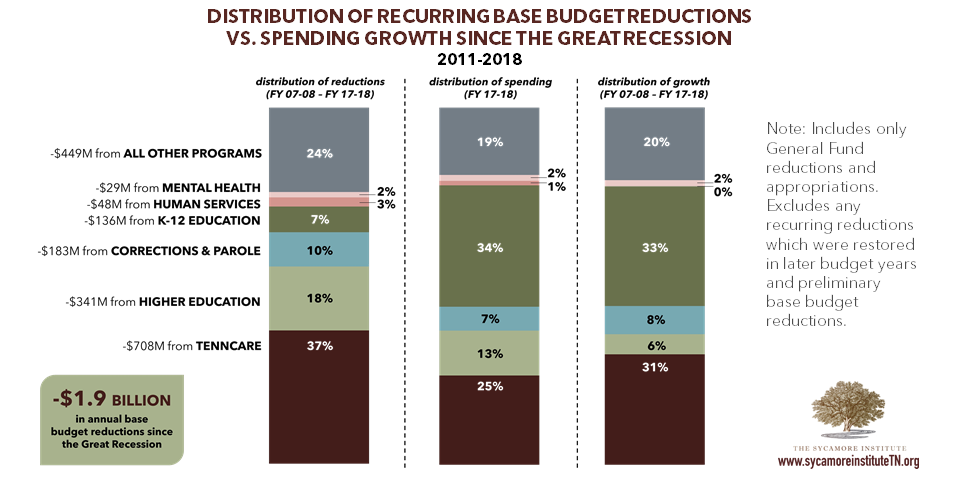
Figure 8 Sources: The Sycamore Institute’s analysis of “6-Year Recurring Base Reduction Summary – State Appropriations FYs 2009 through 2013 Recommended” (p59) of the FY 2013-2014 Tennessee State Budget: Volume 2 Base Budget Reduction, “Seven-Year Recurring Base Reduction Summary – State Appropriations FYs 2012 through 2018 Recommended” (p9) of the FY 2017-2018 Tennessee State Budget: Volume 2 Base Budget Reductions, and “Comparison of Programs” (ppA17-A22) from the FY 2017-2018 Tennessee State Budget.
Over the last 10 years, state policymakers have also prioritized cutting the state’s spending liabilities to respond to revenue shortfalls during the Great Recession (2007-2008) and, later, to offset tax cuts. These long-term savings are known as recurring base budget reductions. To provide context for the recommendations in the FY 2017-2018 Budget, the figure above shows the annual impact of reductions to the General Fund recurring base budget since the Great Recession began in FY 2007-2008.
KEY FACTS:
- The recurring base budget represents expenses that the state government expects to incur year after year and serves as the starting point for each year’s budget decisions. Reductions to the recurring base budget decrease the state’s long-term annual spending.
- Tennessee has enacted -$1.9 billion in recurring base budget reductions since the Great Recession.
- The FY 2017-2018 Budget recommends a total of -$43 million in new recurring base budget reductions. The top 3 reductions include:
- -$20 million from the TennCare program, including -$5 million from payment and delivery system reform savings, -$4 million from lower than expected utilization in the Intellectual and Development Disabilities waiver, and ‑$2 million from changing TennCare’s preferred drug for treating opioid addiction
- -$10 million from Strategic Health Care Programs primarily from the use of reserves and lower expected enrollment in the CoverKids program, which provides health coverage to children in families with incomes under 150% of the federal poverty level
- -$3 million from Corrections related to the food services budget
The Budget recommendation also includes +$42 million in TennCare to restore a prior year’s recurring reduction. This restoration is reflected in Figure 8.
Rainy Day Fund
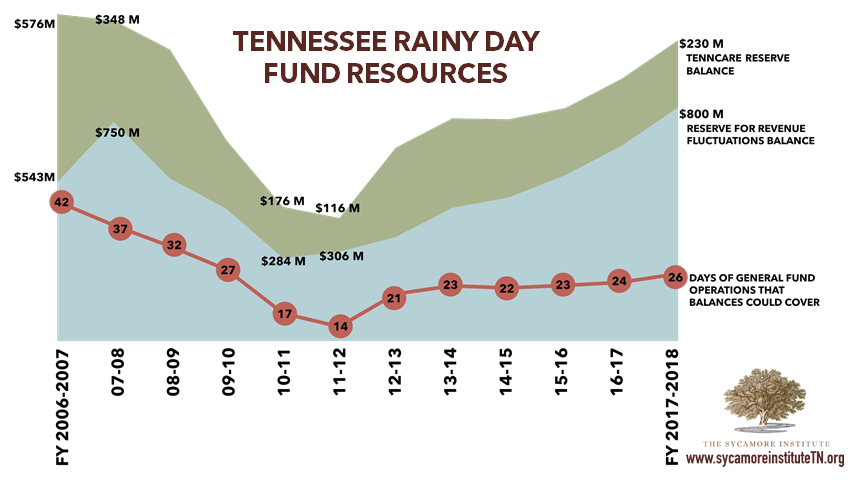
Figure 9 Sources: The Sycamore Institute’s analysis of the FY 2008-2009 through 2017-2018 Tennessee State Budgets.
Economic downturns can create higher-than-usual needs for state programs and services with fewer-than-usual resources to fund them. The state’s balances in the Reserve for Revenue Fluctuations and the TennCare Reserve represent Tennessee’s ability to respond to an economic downturn (see Recommended Budget Primer Reading below).
KEY FACTS:
- The Budget recommends a $132 million deposit to the Reserve for Revenue Fluctuations in FY 2017-2018. This would bring the Reserve for Revenue Fluctuations balance to $800 million – the highest level in the state’s history.
- The Budget recommends a combined balance of $1.0 billion in the Reserve for Revenue Fluctuations and TennCare Reserve. This amount is about $89 million less than what the state had on hand in both reserves in FY 2006-2007 just prior to the Great Recession of 2007-2010.
- The combined reserve balances alone could cover state-funded General Fund operations at recommended Budget funding levels for about 26 days.
- State law sets a target balance for the Reserve for Revenue Fluctuations of 8% of General Fund revenues. The FY 2017-2018 recommended balance represents 7% of estimated FY 2017-2018 General Fund revenues under current law – falling about $84 million short of the 8% target.
- According to a recent fiscal survey of the states, Tennessee’s expected reserve balances at the end of FY 2016-2017 rank 33rd as a percent of state expenditures.
Parting Words
The Governor’s FY 2017-2018 Budget recommendation effectively shifts part of the General Fund’s robust revenue growth to the Highway Fund by cutting taxes for the General Fund and increasing those for the Highway Fund. The Budget also uses projected revenue growth and spending reductions to fund continued cost increases for state employees, TennCare, and K-12 Education along with new investments for capital improvements. It is now the job of the Legislature to consider and act on this recommendation – considering the larger historical context and the trade-offs that each of these decisions represent.
KEY QUESTION: HOW DOES THE BUDGET ADDRESS THE $1.2 BILLION SURPLUS EXPECTED FOR FY 2016-2017?
The projected General Fund in FY 2016-2017 is driven largely by a $656 million surplus from FY 2015-2016 and $512 million in greater-than-budgeted revenues for FY 2016-2017. The Budget recommends putting some of these funds to work in FY 2016-2017 via a $121 million one-time transfer to the Highway Fund and $67 million in supplemental appropriations.
The result of these updated estimates and recommendations for FY 2016-2017 is a projected surplus of $1.2 billion that becomes available as a non-recurring revenue source in FY 2017-2018. The FY 2017-2018 recommendation includes new non-recurring investments in capital projects, economic and community development projects and incentives, and K-12 education, among others.
KEY QUESTION: HOW DOES THE BUDGET USE NEW REVENUE GROWTH EXPECTED FOR FY 2017-2018?
The Budget estimates an increase of +$879 million in General Fund tax revenues in FY 2017-2018 relative to the expected tax revenues on which the FY 2016-2017 budget was based. This includes both the +$512 million greater-than-expected revenues for FY 2016-2017 and an additional +$367 million over the revised FY 2016-2017 estimates.
Some of these increased General Fund revenues are proposed for reduction via the tax proposals included as part of the Governor’s IMPROVE Act. These include reductions to the Franchise & Excise taxes on manufacturers, the Hall Income Tax on investment income, and the sales tax on groceries. The Budget also includes new recurring investments and cost increases related to state employee salary and benefit costs, K-12 Education, TennCare, and Higher Education.
KEY QUESTION: HOW DOES THE BUDGET APPROACH THE BACKLOG OF TRANSPORTATION PROJECTS?
Tennessee has a $6 billion backlog of approved transportation projects and an additional $4.5 billion of projects identified as priorities by the Tennessee Department of Transportation. The Budget proposes addressing this backlog with +$300 million in increased state dollars for the Highway Fund. This increase is made up of expected revenue growth under current law and +$279 million from increases to taxes and fees on fuels, car registrations, and electric and rental cars. These increases are proposed as part of the IMPROVE Act.
Sources Cited
[1] National Association of State Budget Officers, “State Expenditure Report FY 2014-2016,” November 2016. [Online]. LINK
Other Sources Used
Tennessee Department of Finance & Administration, “FY 2017-2018 Tennessee State Budget,” January 2017. LINK
Tennessee Department of Finance & Administration, “FY 2017-2018 Tennessee State Budget, Volume 2: Base Budget Reductions,” January 2017. LINK
Tennessee Department of Finance & Administration, “Commissioner’s Presentation – FY 2018 Recommended Budget,” February 2017. LINK
Tennessee Department of Finance & Administration, “FY 2017-2018 Recommended Budget Overview,” February 2017. LINK