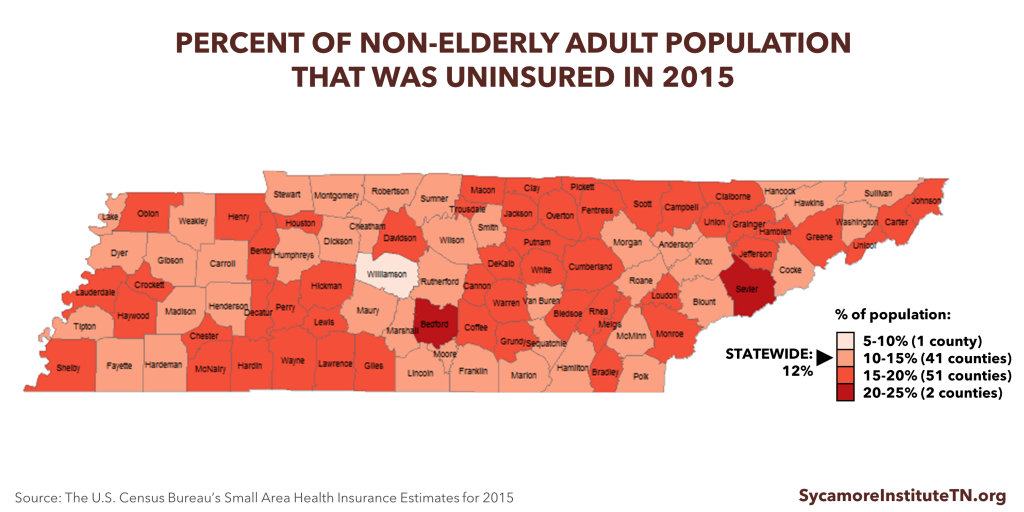
The American Health Care Act (AHCA) passed the U.S. House of Representatives on May 4, 2017 and serves as a starting point for the U.S. Senate to write its own bill to partially repeal and replace the Affordable Care Act (ACA). The House-approved bill could directly affect about 1 in 3 Tennesseans — including Tennesseans who buy health insurance in the individual market, are enrolled in TennCare, or are uninsured. Figures 1-3 and the Data Appendix provide county-level data on the prevalence of these groups across the state.
This report summarizes The Sycamore Institute’s previous analyses of the topic and adds new insights into the AHCA’s impact on rural Tennesseans and those with disabilities.
Bottom Line
Like all public policies, the AHCA involves trade-offs that could require difficult decisions by Tennessee policymakers. This analysis considers how these trade-offs might affect the 1.5 million Tennesseans (22%) who live in rural areas and the 150,000 Tennesseans with disabilities covered by TennCare. We chose these areas because enough data were available for these two populations to conduct a meaningful state-level analysis.
The Individual Market
Compared to today, young and healthy Tennesseans would likely have more access under the AHCA to plans with lower premiums, higher deductibles, and less comprehensive benefits — similar to the individual market prior to the implementation of the ACA. As a result, older and sicker Tennesseans would likely pay more for more comprehensive, ACA-compliant plans.
Despite the potential for lower premium options in rural areas where premiums have been more expensive, many rural Tennesseans’ would likely pay higher out-of-pocket costs due to their poorer health status, unique demographics, and the AHCA’s changes to premium subsidies.
TennCare
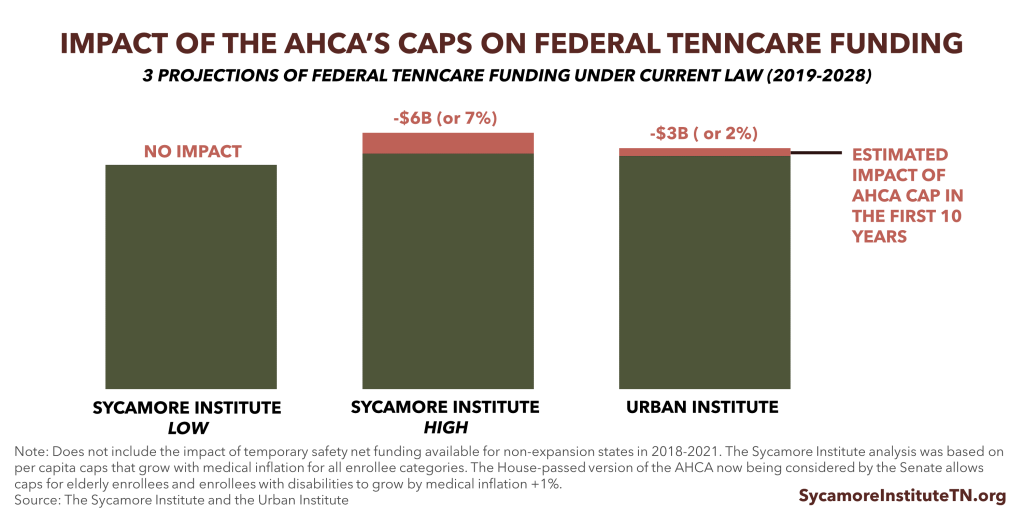
The AHCA’s caps on federal Medicaid spending would likely increase pressure on Tennessee’s state budget, which could disproportionately affect rural areas and enrollees with disabilities. TennCare could potentially receive up to $3.2 billion (or 2.3%) less federal funding than under current law during the caps’ first 10 years. Without new Medicaid design flexibilities, which the AHCA does not provide, state policymakers may respond to potential cost pressures by looking for savings in particularly high-cost areas of TennCare or rolling back optional coverage.
TennCare enrollees with disabilities are a high-cost population, and much of TennCare’s coverage of long-term care for this group is optional for the state. About 10% of TennCare enrollees have disabilities, but their medical and long-term care accounts for about 35% of TennCare medical services spending.
Rural counties have some of the state’s highest rates of TennCare enrollment. As a result, changes to TennCare could have a greater impact on individuals in rural areas.
Tennesseans the AHCA Could Affect – By County
Figure 1
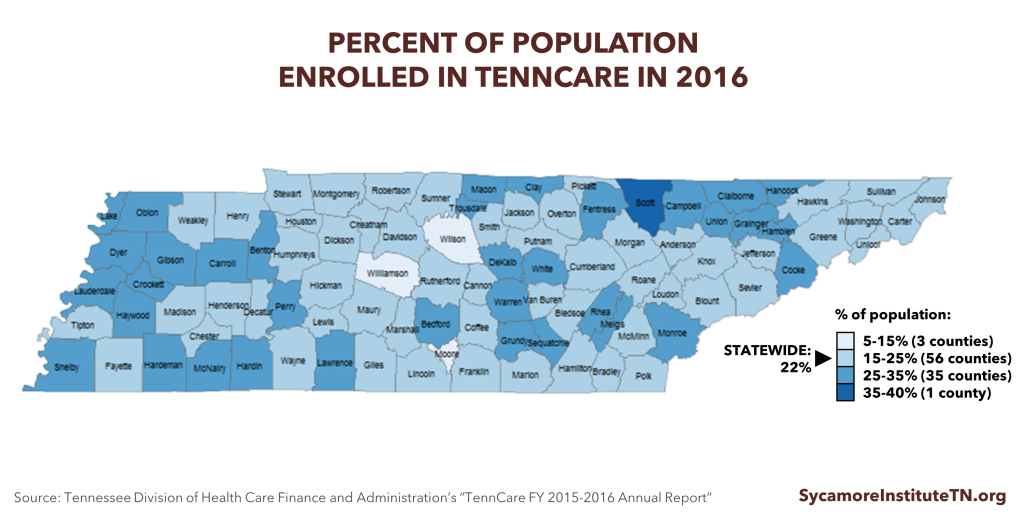
Figure 2
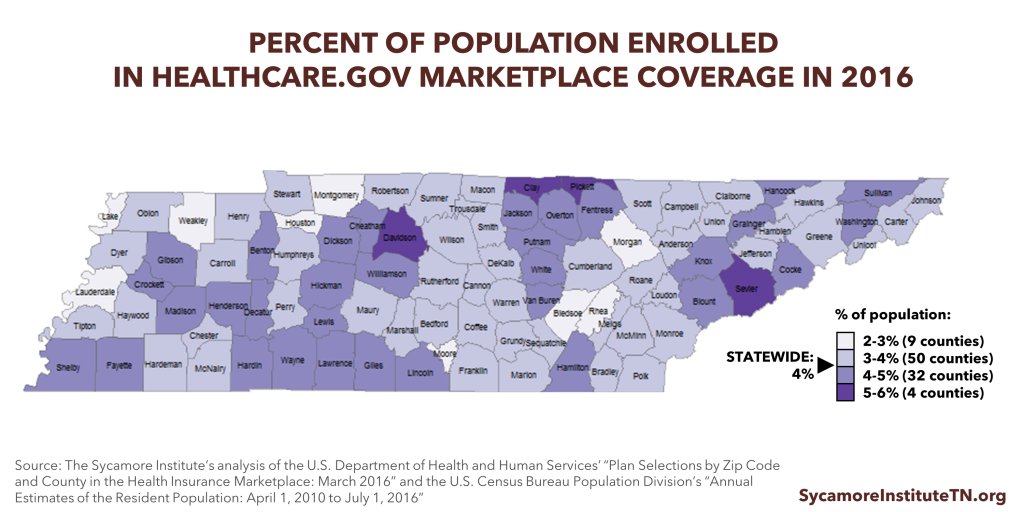
Figure 3
See the DATA APPENDIX for detailed county-level data.
The AHCA’s Overall Impact on Tennessee
Before discussing how the AHCA specifically affects Tennesseans in rural areas and those with disabilities, we will briefly summarize our previously published analysis of how the AHCA affects Tennesseans overall.
How The AHCA Affects Tennessee’s Individual Market
In 2015, about 6% of Tennesseans got health insurance in the individual market (i.e. not through an employer or the government). (5) This year, about 240,000 of these Tennesseans used the healthcare.gov Marketplace (also called “the exchange”) created by the ACA, and the remainder of Tennesseans in the individual market did not. The House-passed AHCA makes a number of changes to the individual market.
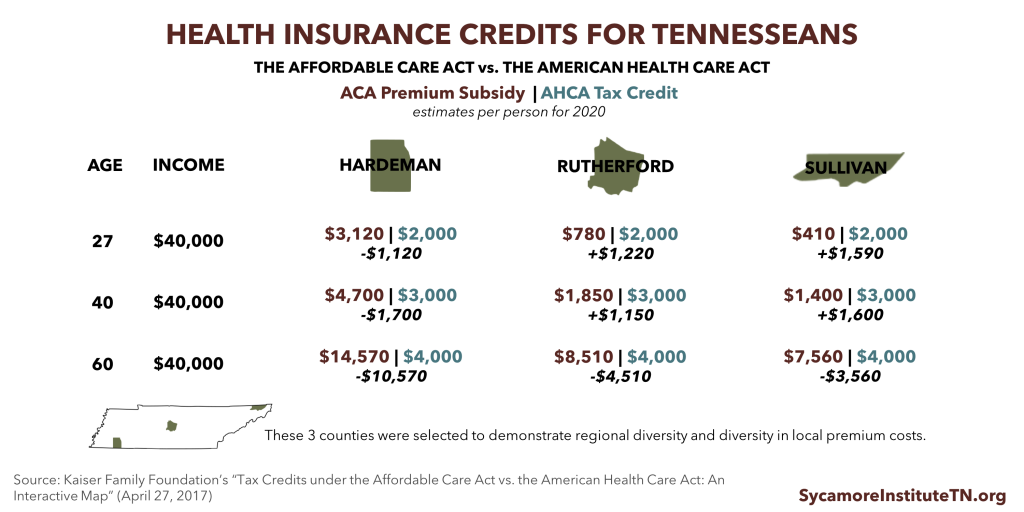
SUBSIDIES FOR INSURANCE COSTS: Plans bought through the Marketplace are eligible for subsidies that vary based on a person’s income and local health insurance costs. The AHCA would replace the ACA’s premium subsidies with tax credits in 2020. The AHCA credits’ value will depend on a person’s income and age rather than the local cost of health insurance (Figure 4). Tennessee’s healthcare.gov Marketplace premiums in 2017 are higher than most other states’, so the AHCA would provide most Tennesseans with a smaller premium subsidy than they get today. How the subsidies affect what each individual actually pays out of pocket for their premiums would vary based on the plan chosen.
Figure 4
“AGE RATING” REQUIREMENTS: The ACA limits premium costs for older individuals to no more than 3 times the costs for younger individuals. Beginning next year, the AHCA would raise that limit to no more than 5 times higher. States could also allow an even higher limit. Tennessee’s individual market did not have this limit prior to the ACA.
ESSENTIAL HEALTH BENEFITS (EHB): States could apply to waive ACA rules regarding EHB which require coverage of benefits like hospital care and prescription drugs starting in 2020. This type of waiver would authorize states to determine what benefits plans in the individual market must offer. Prior to the ACA, for example, Tennessee’s individual market benefit mandates did not include coverage of maternity care or behavioral health care. (7) (8)
COMMUNITY RATING: States could also apply for waivers from community rating requirements starting in 2020. This type of waiver would let insurers set prices in the individual market based on individuals’ gender, occupation, or health status, including pre-existing conditions. Prior to the ACA, for example, Tennessee allowed insurers in the individual market to price on the basis of health, gender, and occupation and to permanently exclude coverage of care for any pre-existing conditions. (9) (10) Including those who get insurance through their employers, as many as 1.3 million to 2.8 million Tennesseans may have a pre-existing condition, according to some estimates. (11) (12)
How the AHCA Affects TennCare
TennCare, Tennessee’s Medicaid program, provides health coverage for about 1 in 5 Tennesseans. TennCare is also the single largest department in the state budget. The AHCA could affect how the state manages TennCare in several ways.
THE WINDOW TO EXPAND MEDICAID CLOSES: The AHCA phases out the ACA’s optional Medicaid expansion, which allows states to provide health coverage to low-income non-elderly non-disabled adults. Tennessee has not expanded Medicaid eligibility and would no longer have the option to do so.
CAPS ON FEDERAL FUNDING FOR TENNCARE: The federal government currently pays for 65% of nearly all the costs of covering TennCare enrollees. Beginning in 2020, the AHCA sets annual caps on federal funding for state Medicaid programs based on each state’s 2016 per enrollee spending, medical inflation, and enrollment in 5 enrollee categories.
- The base-year for the federal funding caps was a low-cost year for TennCare, which could make meeting caps over the long run more difficult for Tennessee.
- Over the last decade, Tennessee’s annual per-enrollee costs have not tracked closely with medical inflation. The state likely would have exceeded a similar cap and received less federal funding in 3 of the last 10 years — even when controlling for federal funding changes during the Great Recession.
- The caps in the House-passed AHCA could result in $3.2 billion (or 2.3%) less federal TennCare funding than projected under current law from 2019-2028, according to the Urban Institute.(13) Analyzing an earlier version of the AHCA, we estimated that more stringent caps could reduce federal TennCare funding by up to $6.0 billion (or 7%) from 2019-2028.[i] Because Tennessee has a relatively low-cost Medicaid program, the caps may not affect our state’s federal funding in the short-term.
- Nearly all analyses agree that capping federal spending on Medicaid will slow the growth of federal funding for nearly every state over the longer-term. See Figure 5 to view our projections alongside the more recent estimate from the Urban Institute. A 2.3% reduction to federal TennCare funding would have equaled about $157 million in FY 2015-2016. This translates to about 1.3% of all federal funding in the state budget, 4.6% of TennCare’s state funding, and 1.0% of all state revenues in the state budget. Any federal funding reductions relative to current law projections would likely be small at first and get larger over time.
- Tennessee would be eligible for an additional $460 million in temporary, one-time safety net funding available for non-expansions states in 2018-2021, according to our estimates.
NO NEW DESIGN FLEXIBILITY: The AHCA does not give states any broad new program design flexibilities, which would likely have to pass separately due to the U.S. Senate’s budget reconciliation rules. Without this flexibility, Tennessee would have to address any gap in TennCare funding by 1) changing TennCare provider payments or eligibility, benefits, and enrollee responsibilities to the extent currently allowed under law, 2) by raising new revenues, or 3) by shifting state dollars from other budget priorities.
Some believe that federal regulatory changes can provide states new program design flexibilities, while others contend they would require acts of Congress. If the AHCA becomes law and states receive new program design flexibilities, policymakers could have more discretion to address funding gaps.
For a comprehensive analysis of Medicaid caps and block grants, see:
Medicaid Reform 101: More Than Just Block Grants (January 26, 2017)
How U.S. House Medicaid Reforms Could Impact TennCare (March 10, 2017)
TennCare’s Federal Funding Under the AHCA (March 14, 2017)
Understanding Medicaid and TennCare: Key Concepts and Context to Know (June 1, 2017)
Figure 5
Deeper Dive: How Trade-Offs Impact Key Populations
Like all public policies, the AHCA involves overarching trade-offs that can affect various populations in different ways.
For the individual market, the AHCA’s key trade-off is to make health insurance more affordable for younger and/or relatively healthier individuals but less affordable for individuals who are older, have greater health care needs, or live in high-cost areas. The AHCA is likely to increase access to lower-cost, lower-benefit insurance options for younger, healthier individuals similar to what was available prior to the ACA. By segmenting the risk pool, this change would likely increase the cost and reduce the availability of the more comprehensive plans required under the ACA.
As a result, many older and/or less healthy Tennesseans may face higher premiums for plans that meet their health care needs, higher out-of-pocket costs (i.e. deductibles, copayments, and coinsurance), and fewer options, according to the nonpartisan Congressional Budget Office (CBO). CBO expects the degree to which older and sicker individuals might face higher costs would depend on the degree to which state policymakers use the AHCA’s optional waivers. Individuals in areas with high premiums would also likely receive smaller subsidies. (15)
For Medicaid, the AHCA’s key trade-off is to slow the growth of federal Medicaid spending but place greater pressure on state budgets. (15) This pressure could force Tennessee-level changes to TennCare eligibility, benefits, and provider payments, other areas of state spending, or state taxes. States might get additional Medicaid program design flexibilities in the future, but they are not included in the AHCA.
Each of these broader trade-offs would affect various populations in different ways. The rest of this report explores how these trade-offs may affect the 1.5 million Tennesseans who live in rural areas and the 150,000 Tennesseans with disabilities who are enrolled in TennCare.
Tennessee’s Rural Health Challenges
Tennessee’s rural areas face unique demographic and health challenges which the AHCA and ensuing decisions by state policymakers could affect. An estimated 1.5 million Tennesseans (22%) live in a rural area. (16)
Figure 6
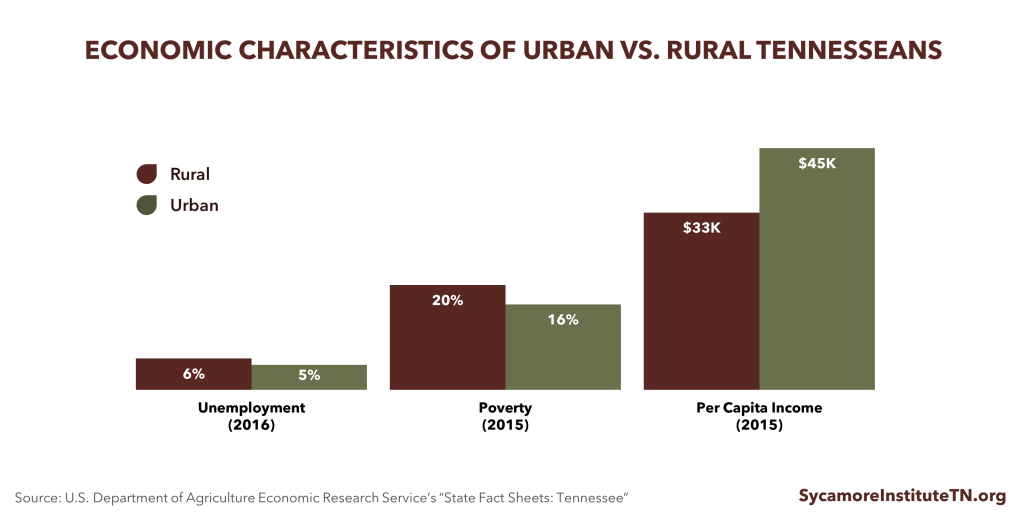
DEMOGRAPHICS: Tennesseans living in rural areas tend to be older, poorer, and less healthy than those who live in other areas of the state. Compared to urban areas, Tennesseans living in rural areas are older, have lower per capita incomes, higher rates of poverty, higher unemployment rates, and lower levels of educational attainment (Figure 6). (16) Rural Tennessee residents also have higher rates of diabetes, obesity, heart disease, chronic obstructive pulmonary disease, prescription drug overdoses, and premature mortality than urban Tennesseans. (17) (18)
ACCESS TO HEALTH CARE: People living in rural areas face challenges in accessing care due to provider shortages, hospital closures, and longer travel distances to providers. (19) In 2015, Tennessee’s rural hospitals provided more than $292 million in uncompensated care. (20) Since 2010, 9 rural hospitals in Tennessee have closed, resulting in a loss of 354 beds. Only Texas, with 11 closures, has had more. While changes in health care delivery have moved the predominant site of care from inpatient to outpatient settings, hospital closures may leave people without a local source of care, particularly for emergencies. Hospitals also provide employment and generate economic activity in the communities they serve. (20)
HEALTH INSURANCE COSTS: Rural Tennessee counties are more likely to have higher Marketplace premiums than other counties. In 2017, Tennessee’s Marketplace premiums were about 27% higher than average premiums across all states using healthcare.gov. (21) Premiums in half of the state’s most rural counties were at least 50% higher than the national average (see Data Appendix).
TENNCARE ENROLLMENT: Rural areas have some of the highest TennCare enrollment rates in Tennessee (Figure 1). In 2015, 50% of children and 17% of adults in non-metro areas in Tennessee were enrolled in TennCare, compared to 39% of children and 15% of adults in metro areas. (22)
The AHCA & Tennessee’s Rural Health Challenges: Key Considerations
The AHCA has the potential to increase the availability of lower premium options in rural areas where premiums have been more expensive. However, many rural Tennesseans would likely pay higher out-of-pocket costs due to their poorer health status, unique demographics, and the AHCA’s subsidy changes. The AHCA eases requirements for what and how much Marketplace plans must cover. If insurers can attract younger and healthier enrollees with less comprehensive, lower-premium plans, Tennessee’s rural areas could see a wider range of insurers and plans.
As is the case today, premiums for the same level of coverage are still likely to be more expensive in rural areas than non-rural ones due to demographics, disease prevalence, and low provider supply. Because premium tax credits would no longer vary based on local health insurance costs, financial assistance for many rural Tennesseans would be less generous, and out-of-pocket premium costs could go up.
Changes in the AHCA could increase out-of-pocket costs and reduce access to health services for Tennesseans with greater health care needs — of which rural areas have a disproportionate share. The AHCA increases the spread between what insurers can charge older and younger individuals. Rural areas would feel the downside of this trade-off more acutely because their populations skew older. The ability for states to seek waivers of ACA requirements for EHB and community rating also means insurers may be able to charge higher premiums for less healthy individuals, require greater cost-sharing for certain services, or no longer provide certain kinds of benefits.
If the AHCA increases rural Tennesseans’ exposure to out-of-pocket costs, rural hospitals may end up providing more uncompensated care. This would be particularly difficult for rural hospitals that are already financially vulnerable. If additional rural hospitals are forced to close, some rural Tennesseans may have difficulty accessing needed health care without traveling long distances. Among Tennessee’s rural hospitals, the 5 hospitals providing the most uncompensated care (as a percent of total net revenue) are located in Cheatham, Hardeman, Hickman, Bledsoe, and Carroll counties. (23)
Because of their higher rates of TennCare enrollment, residents of rural counties may be more likely to feel the effects of any changes to Medicaid. This ultimately depends on decisions made by state policymakers.
TennCare Coverage for Individuals with Disabilities
The AHCA’s new caps on federal Medicaid funding could create budgetary pressures that lead state policymakers to reduce TennCare coverage for Tennesseans with disabilities. Although Tennessee has successfully constrained costs in this area, TennCare enrollees with disabilities rely on services rarely covered by private health insurance and remain expensive to cover.
COVERAGE: TennCare funds long-term services and supports (LTSS) and medical care for Tennesseans with many different kinds of disabilities. LTSS help individuals complete daily self-care tasks like eating, bathing, and taking medications. TennCare pays for and delivers these services in nursing homes and as home- and community-based services (HCBS). HCBS are far less expensive than nursing home care.
- About 147,000 Tennesseans with disabilities receive TennCare-funded coverage for medical and behavioral health services and drug costs. (24)
- About 30,000 elderly Tennesseans and Tennesseans with physical disabilities receive TennCare-funded LTSS through the CHOICES program. The CHOICES program covers both HCBS and nursing home care.(24) (25)
- Almost 8,000 Tennesseans with intellectual and developmental disabilities (ID/DD) receive TennCare-funded LTSS via the Tennessee Department of Intellectual and Developmental Disabilities (DIDD). These programs (often called the “DIDD waivers”) closed to new enrollment in July 2016.(26)
- About 1,700 Tennesseans with ID/DD receive TennCare-funded home- and community-based LTSS through the new Employment and Community First (ECF) CHOICES program.(27)
COSTS: Individuals with disabilities represent only about 10% of TennCare enrollees, but medical and CHOICES LTSS expenses for this population represent 35% of TennCare’s medical services spending. (28) (24) Individuals with disabilities often have high medical and LTSS costs. In fact, medical services (including drug costs) for TennCare enrollees with disabilities cost about 4.5 times that of all other enrollees. CHOICES LTSS costs are about 17 times other enrollees’ medical costs (Figure 7). Private insurance plans rarely cover LTSS. (29) In fact, Medicaid programs nationwide are the single largest payer for LTSS. (28) Because they can be so costly, paying for LTSS out of pocket would likely be unaffordable for most if not all current TennCare enrollees. (29)
USE OF FLEXIBILITIES: TennCare has relied heavily on existing flexibilities in federal Medicaid law to increase coverage of LTSS for individuals with disabilities. Table 1 compares what federal law requires with what and whom TennCare covers. We estimate about 22,000 elderly Tennesseans and Tennesseans with disabilities receive optional TennCare-funded home- and community-based LTSS. This includes all enrollees in the DIDD waivers and ECF CHOICES and about 42% of CHOICES enrollees receiving home- and community-based LTSS in state FY 2016. (25) In the absence of federal TennCare funding for the DIDD waivers, the state would likely have to fully fund services for this population with its own dollars due to legal obligations. Furthermore, many of these individuals with disabilities are eligible for TennCare coverage of medical services because of Tennessee’s use of optional LTSS eligibility criteria.
Figure 7
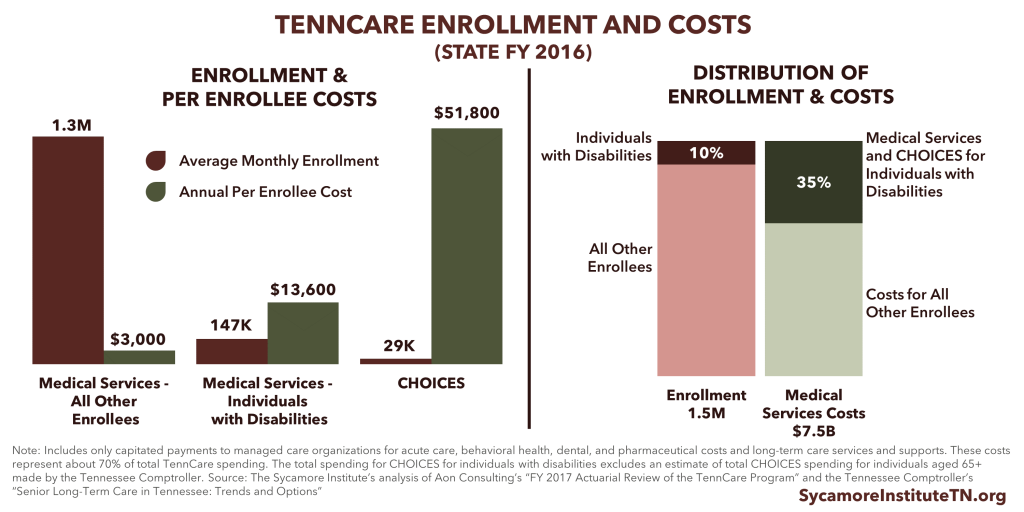
Table 1. Federal Requirements Vs. TennCare Coverage for People with Disabilities |
||
|---|---|---|
| What’s Required Under Federal Law? | What’s Optional Under Federal Law? | What’s Covered by TennCare? |
| Medical services must be provided to seniors and individual with disabilities receiving Supplemental Security Income (SSI), which amounts to an annual income of about $8,820 per year (or 74% of the federal poverty line (FPL)) and $2,000 in assets for an individual. | If states use federal flexibilities to extend LTSS to other populations, those populations must also be granted access to medical services. | TennCare covers medical services for seniors and individuals with disabilities receiving SSI and individuals who are eligible for LTSS. |
| LTSS must be provided to seniors and individuals with disabilities receiving SSI who need the level of care traditionally provided in a nursing home. | States have the flexibility to expand LTSS services to other individuals not otherwise eligible using a state-defined “level of care” criteria to determine eligibility (e.g. to identify individuals “at risk” for needing nursing home level of care). | TennCare covers LTSS for seniors and individuals with disabilities – including physical, intellectual, and developmental disabilities – with incomes of up to $24,300 per year (or 224% of FPL), $2,000 in assets, and who need or are at risk for needing nursing home level of care. |
| LTSS services must include nursing home care and/or home health care only for eligible individuals who need nursing home level of care. | All other LTSS benefits – including HCBS and care in an intermediate care facility for individuals with intellectual disabilities (ICF/IID) – are optional under federal law. | TennCare covers both nursing home care and HCBS for eligible individuals needing or at-risk for needing nursing home level of care. TennCare also covers ICF/IID. |
Source: Kaiser Family Foundation, the Medicaid Payment and Access Commission, and the Tennessee Division of Health Care Finance and Administration (28) (30) (31) (32)
COST CONTROL: Over the last decade, Tennessee has undertaken significant efforts to control LTSS costs for individuals with disabilities. (28) Tennessee’s use of optional eligibility and benefits under current law reflect a nationwide effort to prevent people from going into nursing homes and to “rebalance” the site of care for the elderly and individuals with disabilities. HCBS cost less than nursing home care and allow individuals to stay in their homes and communities.
TennCare’s successful efforts to constrain LTSS costs for this population include shifting individuals who need nursing home care into HCBS and providing HCBS to individuals at risk of needing nursing home care. The average annual TennCare reimbursement for individuals needing a nursing home level of care is over $60,000 per person at nursing homes versus $17,000 for HCBS. At $8,000, the cost of HCBS for seniors at risk of needing a nursing home level of care is even lower. (33) (28) Additionally, under the DIDD waivers, TennCare spends nearly twice the national average on individuals with ID an impetus for the recent establishment of the ECF CHOICES program. (34) Over the last decade, Tennessee has reduced the proportion of LTSS enrollees in nursing home care from almost 97% to about 60% while increasing the proportion receiving HCBS from 3% to 40%. (35)
The AHCA & TennCare Enrollees with Disabilities: Key Considerations
New funding pressures on TennCare due to the AHCA may prompt state policymakers to focus their limited dollars on non-optional Medicaid populations and services. This could have a disproportionate impact on the services offered to TennCare enrollees with disabilities and undermine our state’s successful efforts to reduce the cost of those services — which private insurance rarely covers.
The AHCA’s federal caps on Medicaid funding may ultimately have little impact on TennCare coverage for enrollees with disabilities due to the program’s recent success in controlling LTSS costs. Based on our analysis of TennCare’s actuarial reports, Tennessee would have been under the AHCA’s cost growth cap for individuals with disabilities in each of the last 5 years. (36)
If the cost of covering other populations exceeds the AHCA’s caps, TennCare could reallocate funding away from individuals with disabilities. Under the AHCA, the spending caps for individuals with disabilities and the elderly can grow faster than the caps for other groups (medical inflation + 1% vs. medical inflation only). If TennCare continued to stay under the cap for individuals with disabilities, the AHCA allows it to use those “savings” to make up for any areas where spending exceeds the cap. Nationally, TennCare had the 8th lowest per enrollee costs for individuals with disabilities in federal FY 2011but the 7th highest per enrollee costs for non-disabled adults. (37)
Parting Words
Because of new state flexibilities and potential impacts on the state budget, the changes in the AHCA and the trade-offs they entail may require difficult decisions by Tennessee’s policymakers. Under the AHCA:
- Health insurance premium costs in the individual market are likely to fall for young and healthy people while rising for older and less healthy people.
- Spending caps will slow the growth of federal Medicaid spending but place greater pressure on state budgets. This pressure could lead states to find new efficiencies, spend more of their own money, or reduce Medicaid coverage, eligibility, or provider payments.
All policy decisions have trade-offs, and Tennessee’s policymakers should understand how those trade-offs may affect our residents in rural areas and those with disabilities.
Related Research
Budget Reconciliation and the Affordable Care Act (January 3, 2017)
Medicaid Reform 101: More Than Just Block Grants (January 26, 2017)
How U.S. House Medicaid Reforms Could Impact TennCare (March 10, 2017)
TennCare’s Federal Funding Under the AHCA (March 14, 2017)
AHCA vs. ACA: Tax Credits, Insurance Premiums, & the Big Picture (March 16, 2017)
Health Insurance Markets 101: Key Concepts that Influence Access and Affordability (April 5, 2017)
Reinsurance & High-Risk Pools: What Are They and Why Do They Matter for Tennessee (April 11, 2017)
Tennessee’s High-Risk Pool Experience (April 11, 2017)
How the U.S. House Health Bill Affects Tennessee (May 10, 2017)
Understanding Medicaid and TennCare: Key Concepts and Context to Know (June 1, 2017)
[i] Our previous presentation of these estimates looked at the projected impact over the next 10 years (state FY 2017-2026). To allow for comparisons with the Urban Institute’s estimates, we extended our projection window by 3 years to capture the estimated impact of the first 10 years of the caps (2019-2028).
References
[1] Tennessee Division of Health Care Finance and Administration. TennCare FY 2015-2016 Annual Report. [Online] https://www.tn.gov/content/dam/tn/tenncare/documents/tenncareannual1516.pdf
[2] U.S. Department of Health and Human Services. Plan Selections by Zip Code and County in the Health Insurance Marketplace: March 2016. [Online] March 11, 2016. https://aspe.hhs.gov/basic-report/plan-selections-zip-code-and-county-health-insurance-marketplace-march-2016
[3] U.S. Census Bureau. Annual Estimates of the Resident Population: April 1, 2010 to July 1, 2016. [Online] January 12, 2017. https://factfinder.census.gov/faces/tableservices/jsf/pages/productview.xhtml?src=bkmk
[4] —. Small Area Health Insurance Estimates. [Online] https://www.census.gov/data-tools/demo/sahie/#/
[5] Kaiser Family Foundation. Health Insurance Coverage of the Total Population, 2015. [Online] http://www.kff.org/other/state-indicator/total-population/?currentTimeframe=0&sortModel=%7B%22colId%22:%22Location%22,%22sort%22:%22asc%22%7D
[6] —. Premiums and Tax Credits Under the Affordable Care Act vs. the American Health Care Act: Interactive Maps. [Online] April 27, 2017. http://www.kff.org/interactive/tax-credits-under-the-affordable-care-act-vs-replacement-proposal-interactive-map/
[7] —. Pre-ACA State Maternity Coverage Mandates: Individual and Small Group Markets. [Online] 2010. http://www.kff.org/other/state-indicator/pre-aca-state-maternity-coverage-mandates-individual-and-small-group-markets
[8] —. Pre-ACA State Mandated Benefits in the Small Group Health Insurance Market: Mandated Coverage in Mental Health. [Online] 2010. http://www.kff.org/other/state-indicator/pre-aca-state-mandated-benefits-in-the-small-group-health-insurance-market-mandated-coverage-in-mental-health
[9] —. Individual Market Rate Restrictions . [Online] 2012. http://www.kff.org/other/state-indicator/individual-market-rate-restrictions-not-applicable-to-hipaa-eligible-individuals
[10] Kaiser Family Foundation . Individual Market Portability Rules . [Online] 2013. http://www.kff.org/other/state-indicator/individual-market-portability-rules/
[11] Claxton, Gary, et al. Pre-existing Conditions and Medical Underwriting in the Individual Market Prior to the ACA. Kaiser Family Foundation. [Online] December 2016. http://files.kff.org/attachment/Issue-Brief-Pre-existing-Conditions-and-Medical-Underwriting-in-the-Individual-Insurance-Market-Prior-to-the-ACA
[12] U.S. Department of Health and Human Services. Compilation of State Data on the Affordable Care Act. [Online] https://aspe.hhs.gov/compilation-state-data-affordable-care-act
[13] Holahan, John, et al. The Impact of Per Capita Caps on Federal and State Medicaid Spending and Medicaid Coverage: An Update. Urban Institute. [Online] June 2017. http://www.urban.org/sites/default/files/publication/90991/2001313-the_impact_of_the_ahca_on_federal_and_state_medicaid_spending_and_coverage_update.pdf
[14] —. The Impact of Per Capita Caps on Federal and State Medicaid Spending. Urban Institute. [Online] March 2017. https://www.urban.org/research/publication/impact-capita-caps-federal-and-state-medicaid-spending
[15] Congressional Budget Office. Cost Estimate: H.R. 1628 American Health Care Act of 2017. [Online] May 24, 2017. https://www.cbo.gov/system/files/115th-congress-2017-2018/costestimate/hr1628aspassed.pdf
[16] U.S. Department of Agriculture (USDA) Economic Research Service. State Fact Sheets: Tennessee. [Online] June 2017. https://data.ers.usda.gov/reports.aspx?StateFIPS=47&StateName=Tennessee&ID=17854
[17] Rural Health Reform Policy Research Center. The 2014 Update of the Rural-Urban Chartbook. The North Dakota and NORC Rural Health Reform Policy Reserach Center. [Online] October 2014. https://ruralhealth.und.edu/projects/health-reform-policy-research-center/pdf/2014-rural-urban-chartbook-update.pdf
[18] Tennessee Department of Mental Health and Substance Abuse Services. Prescription for Success: Statewide Strategies to Prevent and Treat the Prescription Drug Abuse Epidemic in Tennessee. [Online] 2014. https://www.tn.gov/assets/entities/behavioral-health/sa/attachments/Prescription_For_Success_Full_Report.pdf
[19] Foutz, Julia, Artiga, Samantha and Garfield, Rachel. The Role of Medicaid in Rural America. Kaiser Family Foundation. [Online] April 2017. http://files.kff.org/attachment/Issue-Brief-The-Role-of-Medicaid-in-Rural-America
[20] Tennessee Hospital Association. 2017 Rural Impact Report. [Online] March 2017. https://secure.tha.com/files/pr/Rural%20Impact%20Report%202017%20Final.pdf
[21] U.S. Department of Health and Humans Services. Health Plan Choice and Premiums in the 2017 Health Insurance Marketplace. [Online] October 24, 2016. https://aspe.hhs.gov/pdf-report/health-plan-choice-and-premiums-2017-health-insurance-marketplace
[22] Hoadley, Jack, et al. Medicaid in Small Towns and Rural America. Rural Health Policy Project. [Online] June 2017. https://ccf.georgetown.edu/wp-content/uploads/2017/06/Rural-health-final.pdf
[23] Tennessee Department of Health. Joint Annual Report for Hospitals 2015: Report 5. [Online] 2017. https://apps.health.tn.gov/PublicJARS/Reports/hospital/Current/Summary.pdf
[24] Felsted, Sterling. Actuarial Review of the TennCare Program: Development of State Fiscal Year 2017 Per Member Costs. Aon Consulting. [Online] 2017. https://www.tn.gov/assets/entities/tenncare/attachments/actuarial17.pdf
[25] Tennessee Division of Health Care Finance and Administration. TennCare: Fiscal Year 2015-2016 Annual Report. [Online] https://www.tn.gov/assets/entities/tenncare/attachments/tenncareannual1516.pdf
[26] Tennessee Department of Intellectual and Developmental Disabilities. Data Management Report. [Online] May 2017. https://www.tn.gov/assets/entities/didd/attachments/DIDD_Data_Management_Report_May_2017.pdf
[27] Tennessee Division of Health Care Finance and Administration. FY 2018 Budget Presentation. [Online] 2017. https://www.tn.gov/assets/entities/hcfa/attachments/HCFAbudgetFY18.pdf
[28] Mattson, Susan and Bergfeld, Tara. Senior Long-Term Care in Tennessee: Trends and Options. Tennessee Comptroller of the Treasury Office of Research and Accountability. [Online] April 2017. http://www.comptroller.tn.gov/Repository/RE/aging.pdf
[29] Reaves, Erica and Musumeci, MaryBeth. Medicaid Long-Term Services and Supports: A Primer. Kaiser Family Foundation. [Online] December 15, 2015. http://www.kff.org/medicaid/report/medicaid-and-long-term-services-and-supports-a-primer/
[30] Medicaid Payment and Access Commission (MACPAC). Medicaid Optional Long-Term Services and Supports. [Online] 2014. https://www.macpac.gov/medicaid-optional-long-term-services-and-supports-2/
[31] —. Mandatory and Optional Benefits. [Online] 2017. https://www.macpac.gov/subtopic/mandatory-and-optional-benefits/
[32] Tennessee Division of Health Care Finance and Administration. TennCare Eligiblity Reference Guide. [Online] 2017. https://www.tn.gov/assets/entities/tenncare/attachments/eligibilityrefguide.pdf
[33] —. Memo to TennCare MCOs: Revised Average Costs of Level 1 and Level 2 Nursing Facility Reimbursement. [Online] February 27, 2017.
[34] —. Presentation: Employment and Community First CHOICES. [Online] https://www.tn.gov/assets/entities/tenncare/attachments/introductionToEcfChoices.pdf
[35] —. LTC Enrollment by Calendar Year. [Online] 2017. https://www.tn.gov/tenncare/long-term-services-supports/ltss-governors-dashboard-graphs.html
[36] The Sycamore Institute. The Sycamore Institute’s Analysis of TennCare’s Actuarial Reports for FYs 2013 – 2017. [Online] https://www.tn.gov/tenncare/information-statistics/actuarial-report.html
[37] Kaiser Family Foundation. Medicaid Spending Per Full-Benefit Enrollee: FY 2011. [Online] 2017. http://www.kff.org/medicaid/state-indicator/medicaid-spending-per-full-benefit-enrollee/
[38] U.S. Census Bureau. 2010 Census. [Online] http://factfinder.census.gov
Featured Image at top by OakleyOriginals / CC BY 2.0